
- Title
-
Trans-2-phenylcyclopropylamine regulates zebrafish lateral line neuromast development mediated by depression of LSD1 activity
- Authors
- He, Y., Yu, H., Sun, S., Wang, Y., Liu, I., Chen, Z., and Li, H.
- Source
- Full text @ Int. J. Dev. Biol.
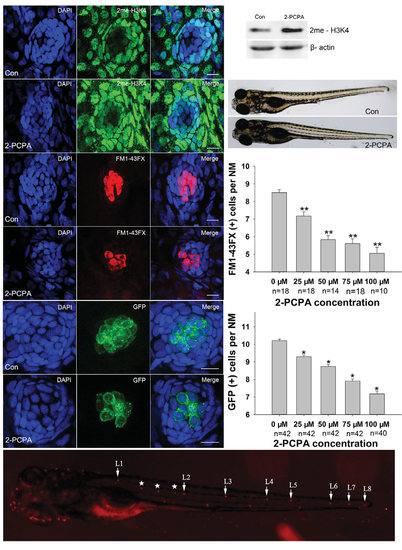
Neuromast hair cell detection in 5 dpf larvae. (A-C) Effect of 2-PCPA on the levels of histone methylation. Confocal projections of neuromasts of 5 dpf control (A) and 75 µM 2-PCPA treated larvae (B) that have been labeled by dimethyl H3K4 (2me-H3K4). Larvae were stained (green) by immunocytochemistry for dimethyl H3K4. The level of 2me-H3K4 was increased in the presence of 2-PCPA as compared to the controls. (C) Western blot analysis of protein extracted from control and 2-PCPA treated larvae. 2-PCPA treatment induced accumulation of 2me-H3K4 on global histone. β-actin levels were included as a control. (D-E) Neuromast hair cells detection with live staining (FM1-43FX) in 5 dpf larvae. Confocal projections of L1 neuromasts of control (D) and 2-PCPA treated larvae (E) at 5 dpf that have been labeled by FM1-43FX for functional hair cells. Fewer FM1-43FX positive cells were developed in 75 µM 2-PCPA treated larvae than in control. (F-G) Number of neuromast hair cells assessed with GFP visualisation in transgenic line Tg(brn3c:mGFP). GFP expression in neuromasts of control (F) and 2-PCPA treated larvae (G) at 5 dpf. There was a significant decrease in the number of hair cells in larvae received 2-PCPA treatment. Nuclei were stained with DAPI. Scale bars =10 µm. (H) Both the zebrafish larvae treated with 75 µM 2-PCPA from 3 dpf to 5 dpf (lower panel) and control (upper panel) were morphologically normal. (I-J) Quantification of hair cells under 2-PCPA treatment during the early hair cell development period. (I) The average number of functional hair cells per neuromast in 5 dpf zebrafish larvae following 2-PCPA treatment. Graph of functional HCs as seen with FM1-43FX. (J) The average number of differentiated hair cells per neuromast in 5 dpf zebrafish larvae. The number of GFP positive cells were decreased in larvae received 2-PCPA treatment in a dose-dependent manner. The hair cells of the first four neuromast along the body, L1 to L4, were recorded on one side of each fish (n: total number of fish per 2-PCPA dose). Bars are mean ± SEM (one-way ANOVA *P<0.05; **P<0.001). (K) Superimposition of a fluorescent image of a 5 dpf zebrafish larva with neuromasts labelled with FM1-43FX. White arrows point to primary NMs L1 to L8 on the left side of the larva, the image shows secondary NMs (*) and a few NMs from the right side of the larva (not labelled). |
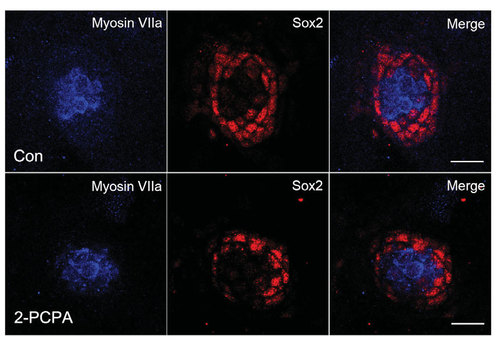
Supporting cell detection with Sox2 in 5 dpf larvae. Confocal projections of neuromasts of control (A) and 75 µM 2-PCPA treated larvae (B) at 5 dpf that have been labeled by Sox2 for supporting cells. Fewer Sox2 positive cells were developed in 2-PCPA treated embryos than in the controls. Hair cells were stained with Myosin VIIa (blue). Red spots represented Sox2 signal. Scale bars, 10 µm. |
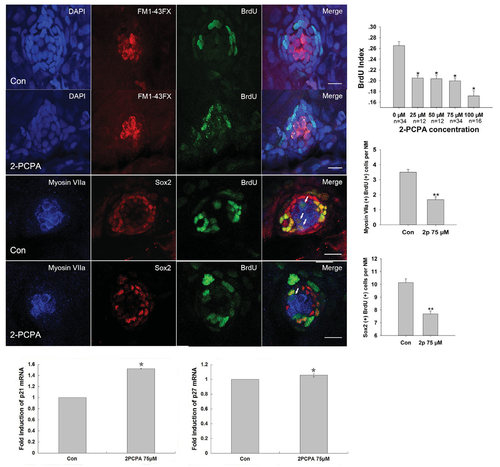
2-PCPA treatment inhibits neuromast cell proliferation. (A-B) Effect of 2-PCPA on neuromast cell proliferation. Confocal projections of neuromasts of 5 dpf control (A) and 75 µM 2-PCPA treated larvae (B) that have been labeled by BrdU for proliferating cells. The number of BrdU-labeled cells was much larger in control than in 2-PCPA treated larvae, and BrdU-labeled cells often located in the periphery of the neuromast. Green spots represented BrdU signal. HCs were labeled with FM1-43FX (red) and nuclei were stained with DAPI (blue). (C-D) 2-PCPA treatment decreased the numbers of both newly formed HCs and SCs within neuromasts. Confocal projections of neuromasts of control (C) and 2-PCPA treated larvae (D) at 5 dpf. HCs were labeled with Myosin VIIa (blue) and SCs were stained with Sox2 (red). Green spots represented BrdU signal. White arrows indicated hair cells that were derived from cell proliferation. Scale bar =10 µm. (E) Quantification of replicating cells in neuromasts in the experimental conditions. BrdU index was higher in the control relative to the 2-PCPA treated larvae (n: total number of fish per 2-PCPA dose). (F) Mean Myosin VIIa-expressing cells colabeled with BrdU per neuromast (NM) in control and 2-PCPA treatment larvae. (G) Quantification of replicating cells colabeled with Sox2 per neuromast (NM) under each condition. The labeled cells of the first four neuromasts along the body, L1 to L4, were recorded on one side of each fish. Bars are mean ± SEM (one-way ANOVA *P<0.05, **P<0.001). (H,I) Real-time RT-PCR analysis showed that 2-PCPA treatment increased the expressions of p21 and p27 at mRNA levels. The bars represent the mean ± SEM of ratio of p21 and p27/GAPDH in the real-time RT-PCR data. |
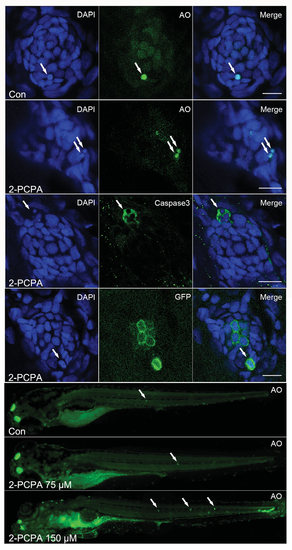
High concentration of 2-PCPA treatment leads to apoptosis. (A-E) 2-PCPA treatment at high concentration (150 µM) induced an enhancement of cellular apoptosis within neuromasts. A-B: AO staining in the neuromast of a control (A) and a 2-PCPA treated larva (B) at 5 dpf. White arrows indicated AOpositive cells. (C) Cleaved Caspase-3 staining in the neuromast of a 150 µM 2-PCPA treated larva at 5 dpf. (D) The detection of hair cell death in neuromast. Neuromast images from brn3c:mGFP larvae treated with 150 µM 2-PCPA. White arrows in (D) showed dying hair cells being extruded from the neuromast. Scale bar =10 µm. (E) 150 µM 2-PCPA treated larva (lower panel) have high levels of acridine orange (AO) staining (white arrows) in neuromasts, compared with control (upper panel) and 75 µM 2-PCPA treated larva (middle panel) at 5 dpf. |