
- Title
-
Conserved and divergent functions of Nfix in skeletal muscle development during vertebrate evolution
- Authors
- Pistocchi, A., Gaudenzi, G., Foglia, E., Monteverde, S., Moreno-Fortuny, A., Pianca, A., Cossu, G., Cotelli, F., and Messina, G.
- Source
- Full text @ Development

Identification and expression analysis of nfixa and nfixb. (A) Each zebrafish nfix gene is shown as a reference locus. Genes annotated as paralogs (no surrounding line) or orthologs (with a surrounding line) by the Ensembl database share the same color; blue lines beneath individual tracks indicate that orientations of gene blocks and are inverted with respect to their genomic annotation. Analysis of chromosomal organization for zebrafish nfixa (chromosome 1), nfixb (chromosome 3), and the human (chromosome 19) and mouse (chromosome 8) Nfix genes. Syntenous human and mouse genes are labeled. The figure was derived from the output of the Genomicus website (version 57.01). (B) Phylogenetic relationship of Nfi genes. Evolutionary comparison of different members of Nfi protein family represented in a Maximum-likelihood bootstrap consensus tree. The zebrafish nfixa and nfixb are highlighted. Branch lengths are measured in terms of amino acid substitutions, with the scale indicated over the tree. Numbers at nodes indicate percent of bootstrap probabilities. Ce, Caenorhabditis elegans; Ci, Ciona intestinalis; Dr, Danio rerio; Ga, Gasterosteus aculeatus; Gg, Gallus gallus; Hs, Homo sapiens; Mm, Mus musculus; Ol, Oryzias latipes; Tn, Tetraodon nigroviridis; Tr, Takifugu rubripes; Xt, Xenopus tropicalis. (C) RT-PCR performed at different developmental stages: ladder (L), one- to two-cell stage (lane 1), 30% epiboly (lane 2), 50% epiboly (lane 3), tail bud (lane 4), eight somites (lane 5), 15 somites (lane 6), 24 hpf (lane 7), 48 hpf (lane 8), 3 dpf (lane 9), 5 dpf (lane 10), adult muscle (lane 11) and negative control (lane 12) in the absence of cDNA. (D,D2) Whole-mount in situ hybridization with nfixa-specific probe at the 5-somite stage and 8-10 somite stage. (D) The transcript is present in the unsegmented paraxial mesoderm and in the notochord (boxed region). (D′) nfixa signal is present in the already segmented somites (arrow) and in the central nervous system (arrowhead). (E) RT-PCR performed on cDNA of muscle cells sorted from α-actin GFP transgenic embryos at 24 and 48 hpf. White line marks lanes run on a separate gel but using the same samples and amounts of input RNA. (F) Quantitative real-time PCR (qRT-PCR) of nfixa mRNA expression normalized to ef1a. |
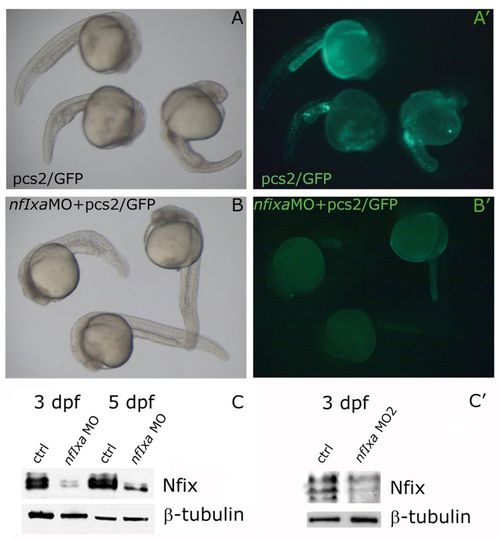
nfixa-MO specifically reduces nfixa-GFP sensor mRNA translation and Nfi protein levels. For the in vivo test of the specificity of nfixa-MO, an nfixa-GFP sensor has been generated. The pCS2+ construct containing the sequence recognized by the nfixa-MO fused with the GFP open reading frame was used for injection experiments with ctrl-MO or with the nfixa-MO. (A,A′) Embryos at 24 hpf: GFP-positive cells in the trunk and in the yolk epithelium following co-injection of the sensor and the control-MO. (B,B′) The complete absence of GFP expression when the sensor is co-injected with nfixa-MO confirms the specificity of the morpholino action. In A,A′, embryos are visualized under normal light; in B,B2 embryos are under fluorescent light. (C,C ) The morpholino efficiency has also been tested by means of western blot experiments; Nfix protein levels are decreased both in AUG-nfixa-MO (C) and splice-nfixa-MO2 (C′) injected embryos in comparison with control embryos at the same developmental stages. |

Slow myosin remains expressed in nfixa-MO injected embryos after 48 hpf. (A) Quantitative real-time PCR (qRT-PCR) of smyhc1 mRNA expression normalized to ef1a. The expression of smyhc1 in control embryos presents a peak at 48 hpf and is then downregulated at 3 and 5 dpf. In nfixa-MO-injected embryos, the expression of smyhc1 remains elevated even after 48 hpf. (B-C′) Whole-mount in situ hybridization with smyhc1 probe replicates qRT-PCR results: at 3 dpf, nfixa-MO-injected embryos (C,C′) still present a stronger signal of smyhc1 than controls (B,B′). B′ and C′ are transverse sections of the tail. (D) Western blot: slow myosins are recognized by F59 antibody; all sarcomeric myosins are recognized by MF20 antibody. At 3 and 5 dpf in nfixa-MO injected embryos, slow and all myosin protein levels are higher than the control, whereas protein levels were recovered in rescued embryos at 3 dpf. Additional lower molecular weight bands in the 3 dpf nfixa-MO MyHC lane correspond to degradation products of the protein. (E-F′) Immunostaining with F59 antibody (slow fibers): at 3 dpf, nfixa-MO-injected embryos (F,F′) present a stronger F59 signal than the control (E,E2). Insets in E′ and F′ show a higher magnification of the tail region. In all figures, lateral views are shown, anterior is always towards the left. Scale bars: 100 μm in B,B′,C,C′,E,F; 200 μm in E′,F′. PHENOTYPE:
|

Slow myosin remains expressed in nfixa-MO injected embryos after 48 hpf. (A) Quantitative real-time PCR (qRT-PCR) of smyhc1 mRNA expression normalized to ef1a. The expression of smyhc1 in control embryos presents a peak at 48 hpf and is then downregulated at 3 and 5 dpf. In nfixa-MO-injected embryos, the expression of smyhc1 remains elevated even after 48 hpf. (B-C′) Whole-mount in situ hybridization with smyhc1 probe replicates qRT-PCR results: at 3 dpf, nfixa-MO-injected embryos (C,C′) still present a stronger signal of smyhc1 than controls (B,B′). B′ and C′ are transverse sections of the tail. (D) Western blot: slow myosins are recognized by F59 antibody; all sarcomeric myosins are recognized by MF20 antibody. At 3 and 5 dpf in nfixa-MO injected embryos, slow and all myosin protein levels are higher than the control, whereas protein levels were recovered in rescued embryos at 3 dpf. Additional lower molecular weight bands in the 3 dpf nfixa-MO MyHC lane correspond to degradation products of the protein. (E-F′) Immunostaining with F59 antibody (slow fibers): at 3 dpf, nfixa-MO-injected embryos (F,F′) present a stronger F59 signal than the control (E,E′). Insets in E2 and F2 show a higher magnification of the tail region. In all figures, lateral views are shown, anterior is always towards the left. Scale bars: 100 μm in B,B′,C,C′,E,F; 200 μm in E′,F′. |

Evolutionarily conserved inhibition of nfatc4 by nfixa and regulation of primary slow fibers. (A) Quantitative real-time PCR (qRT-PCR) of nfatc4 mRNA expression normalized to ef1a. The expression of nfatc4 remains elevated in 48 hpf, 3 and 5 dpf nfixa-MO injected embryos, compared with controls. (B) RT-PCR on control and splice-nfatc4-MO-injected embryos at 24 hpf. RT-PCR primers were designed in exon 1 and exon 3, respectively; the amplification product, which contains the second exon, was 326 bp in control embryos, whereas two bands at 326 bp (arrowhead) and 174 bp (arrow) were detected in splice-nfatc4-MO injected embryos, confirming the partial skipping of the second exon (150 bp). (C-E) Immunostaining with F59 antibody (slow fibers): at 3 dpf, nfixa-nfatc4-MO injected embryos (E) present a F59 signal comparable with controls (C), whereas F59 remains elevated in nfixa-MO-injected embryos (D). EXPRESSION / LABELING:
PHENOTYPE:
|
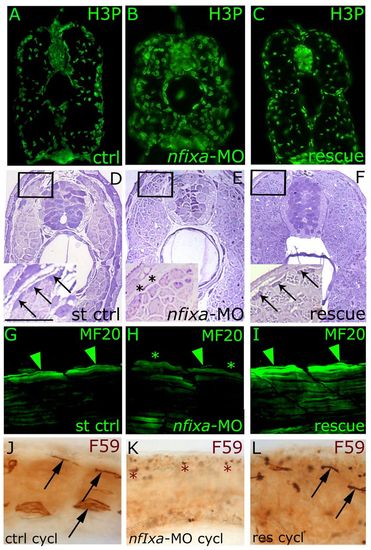
Secondary slow fibers do not form in nfixa-MO-injected embryos. (A-C) Immunohistochemistry experiments with the H3P antibody that recognizes proliferating cells. nfixa-MO-injected larvae (B) presented an increased rating of proliferation at 3 dpf in comparison with controls (A) and rescued larvae (C). (D-I) Secondary fibers at the dorsal and ventral extremes of the superficial muscle monolayer did not form in 3 dpf nfixa-MO-injected embryos (E,H, asterisks) in comparison with controls (D,G, arrows and arrowheads), whereas they are recovered in rescued embryos (F,I, arrows and arrowheads). (D-F) Histological semi-thin sections, inset shows higher magnification. (G-I) Confocal images of MF20 immunostaining. (J,K) Lateral views of F59 labeling, which is maintained in the extreme dorsal and ventral regions of embryos treated with cyclopamine (arrows) but absent in nfixa-MO-injected embryos (K, asterisks). (L) In rescued embryos treated with cyclopamine, the formation of secondary fibers is partially recovered in small areas (arrows). (A-F) Transverse sections, dorsal on top. (G-L) Lateral views, anterior is always towards the left. Scale bar: 100 μm. PHENOTYPE:
|
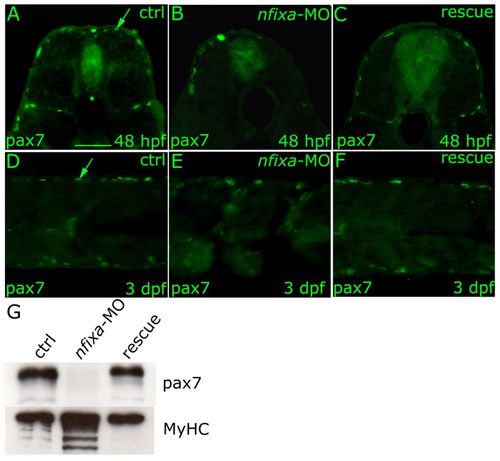
The absence of Pax7-positive progenitor cells in nfixa-MO-injected embryos determines the loss of secondary fibers. (A-F) Immunohistochemistry experiments with the Pax7 antibody that recognizes secondary fiber precursors. Pax7-positive secondary fiber progenitors at the dorsal and ventral extremes of the superficial muscle monolayer did not form in 48 hpf and 3 dpf nfixa-MO-injected embryos (B,E) in comparison with controls (A,D arrow), whereas they are recovered in rescued embryos (C,F). (G) Western blot: secondary fiber precursors were recognized by Pax7 antibody, all sarcomeric myosins MyHC were recognized by MF20 antibody. In isolated tails of nfixa-MO-injected larvae, Pax7 protein levels were higher than the control whereas they were recovered in rescued embryos at 3 dpf. All myosin protein levels were higher in nfixa-MO-injected larvae, as expected. (A-C) 48 hpf transversal sections, dorsal on top. (D-F) 3 dpf longitudinal sections, anterior towards the left. Scale bar: 100 μm. EXPRESSION / LABELING:
PHENOTYPE:
|

Spatial expression of nfixb and nfixa analyzed by whole-mount in situ hybridization. (A) nfixb-specific probe has no signal in somitogenesis. (B,C) At 3 dpf the signals of both nfixb common probe and nfixa specific probe are detected in the central nervous system. t, telencephalon; m, mesencephalon. In all figures, lateral views are shown, anterior is always towards the left. Scale bar: 100 μm. EXPRESSION / LABELING:
|
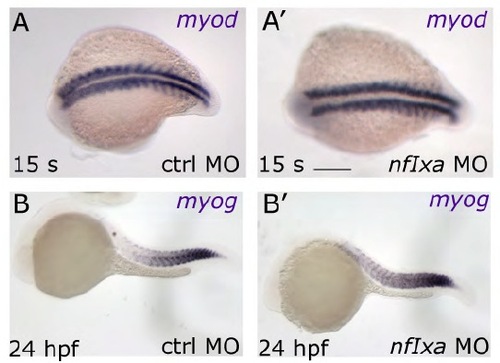
First myogenic wave takes place correctly in nfixa-MO-injected embryos. (A-B′) myod (A,A′) and myog (B,B′) expression patterns in nfixa-MO embryos during somitogenesis and at 24 hpf are the same as control, suggesting that the segmentation process and the first myogenic wave are correctly formed. In A,A′, dorsal views are shown; in B,B′ lateral views are shown. Anterior is always towards the left. Scale bars: 100 μm in A,A′; 150 μm in B,B′. PHENOTYPE:
|
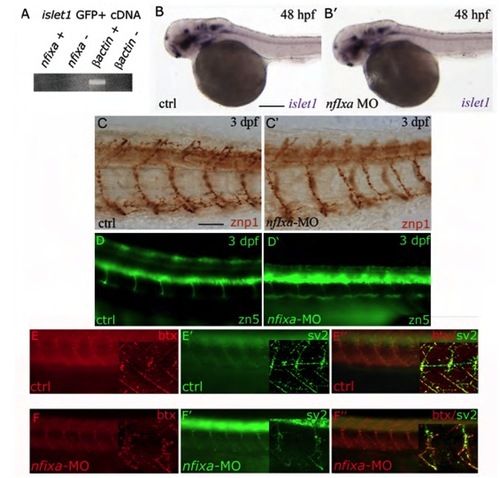
Nfixa loss of function does not influence motoneurons development (A) RT-PCR performed on cDNA of motoneurons sorted from islet1 GFP transgenic embryos at 48 hpf. nfixa is not expressed in this cell population. (B,B′) islet1 expression pattern in nfixa-MO embryos at 48 hpf does not present differences in comparison with control embryos, suggesting that motoneurons are correctly formed. (C-D′) Axonal projections of primary (C,C′) and secondary motoneurons (D,D′) visualized by znp1 and zn-5 antibodies, respectively, are correctly formed in nfixa-MO-injected embryos. (E-F′′) Synapses were labeled with bungarotoxin (BTX red, postsynaptic AChRs) and SV2 (green, presynaptic vesicles) antibodies. The co-localization of both signals in control (E′′) and nfixa-MO injected (F′) embryos showed functional neuromuscular synapses. Main panels are images taken on a fluorescence microscope; insets show single-plane confocal images/projections from a confocal z-stack. PHENOTYPE:
|

Sarcoplasmic reticulum (SR) is correctly formed in skeletal muscle Nfix-null mice. (A-E′′) Investigation of the SR phenotype both in specific skeletal muscle Nfix-null mouse (Nfix-null) fetal E16.5 and in postnatal P3 developmental stages by means of TEM (A-B′), Western blot analyses (C) and immunostaining for RyR (red, D,E). Laminin staining (green, D′,E′); DAPI staining (blue, D′′,E′′). |
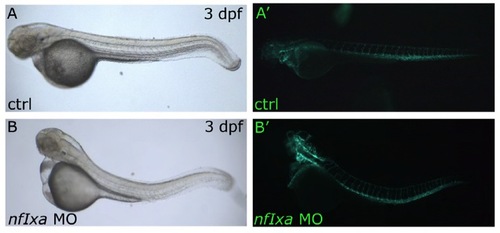
Vessel formation is comparable in control and nfixa-MO fliI-GFP-trangenic injected embryos. (A-B′) Visible (A,B) and fluorescent images (A′,B′) of GFP-vessels visualized in control (A,A′) and nfixa-MO (B,B′) injected embryos at 3 dpf. |

ZFIN is incorporating published figure images and captions as part of an ongoing project. Figures from some publications have not yet been curated, or are not available for display because of copyright restrictions. PHENOTYPE:
|
|
Unillustrated author statements PHENOTYPE:
|