
- Title
-
The alpha2Na+/K+-ATPase is critical for skeletal and heart muscle function in zebrafish
- Authors
- Doganli, C., Kjaer-Sorensen, K., Knoeckel, C., Beck, H.C., Nyengaard, J.R., Honoré, B., Nissen, P., Ribera, A., Oxvig, C., and Lykke-Hartmann, K.
- Source
- Full text @ J. Cell Sci.
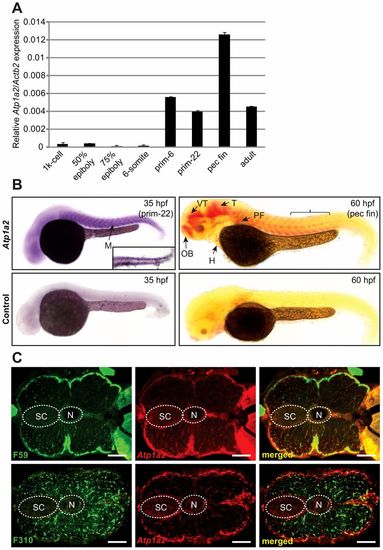
Expression of Atp1a2 mRNA in zebrafish embryos. (A) Atp1a2 mRNA expression was quantified by qRT-PCR and normalized to Actb2. Data are presented as means ± s.e.m. of triplicate measurements. (B) Atp1a2 mRNA expression analyzed by whole-mount in situ hybridization in zebrafish embryos at 35 hpf (NBT/BCIP stained). The inset is a dorsal view of caudal staining at 35 hpf, and 60 hpf (Fast Red staining). Brackets indicate the position of the double-stained sections in C. Lower panel show sense probe negative controls. (C) Transverse sections of embryos double stained by in situ hybridization for Atp1a2 (red fluorescence) in combination with immunostaining using F310 (fast-twitch muscle) or F59 (primarily slow-twitch muscle; green fluorescence). H, heart; M, myotomes; N, notochord; OB, olfactory bulb; PF, pectoral fin; SC, spinal cord; T, midbrain tegmentum; VT, ventral thalamus. Scale bars: 100 μm. |
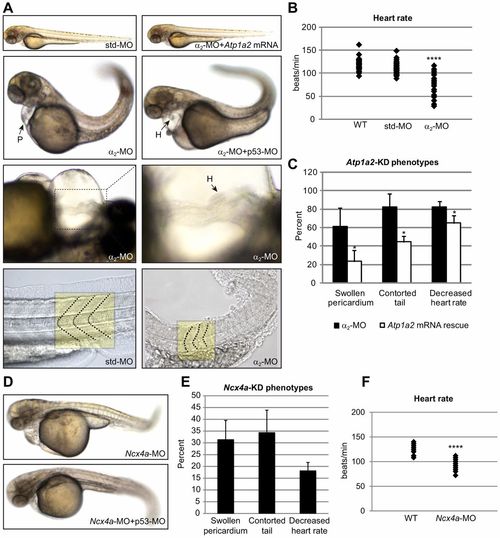
α2-MO-mediated Atp1a2 knockdown affects skeletal and heart muscle. (A) Embryos injected with α2-MO or p53-MO+7alpha;2-MO exhibited a contorted tail, abnormal somite morphology, a swollen pericardium and loss of cardiac laterality. Coinjecting α2-MO with Atp1a2 mRNA rescued knockdown phenotypes demonstrating specificity. Normal and distorted somite borders of std-MO- and α2-MO-injected embryos are indicated by dashed lines in the bottom panel. (B) Heart rates (beats/min) of wild-type (WT), std-MO- and α2-MO-injected embryos at 60 hpf (n = 30) (see supplementary material Movies 1, 2). (C) The penetrance of the observed phenotypes in α2-MO-injected (n = 91) and mRNA-rescued embryos (n = 136), plotted as percentages ± s.d. of embryos displaying the phenotype, relative to total embryo number. (D) Embryos injected with Ncx4a-MO phenocopy the α2-MO-injected embryos. (E) The penetrance of the observed phenotypes in Ncx4a-MO-injected embryos (n = 107), plotted as percentages ± s.d. of embryos displaying the phenotype, relative to total embryo number. (F) Heart rates (beats/min) of WT and bradycardic Ncx4a-MO-injected embryos at 60 hpf (n = 20). *P<0.05, ****P<0.0001. PHENOTYPE:
|
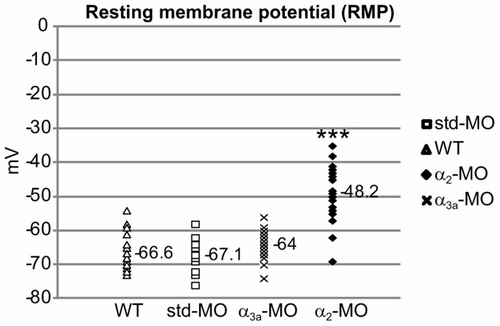
Atp1a2 knockdown reduces the resting membrane potential of slow-twitch muscle cells. RMP values of slow-twitch muscle cells from WT (n = 17), std-MO- (n = 16), α3a-MO- (n = 23) and α2-MO- (n = 19) injected embryos. Mean RMP values are shown. ***P<0.001. PHENOTYPE:
|
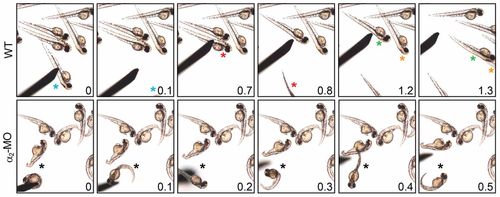
Atp1a2 knockdown causes aberrant mechanosensory response. Successive frame shots from touch response assay performed on WT (top panel) and α2-MO-injected (bottom panel) embryos (see supplementary material Movies 3–5). Touch-stimulated embryos are marked with a color-coded asterisk and the frame shot times are merged on images in seconds. The α2-MO-injected embryo keeps swirling around itself and is seen in all frames, because it cannot swim away as WT embryos can. PHENOTYPE:
|
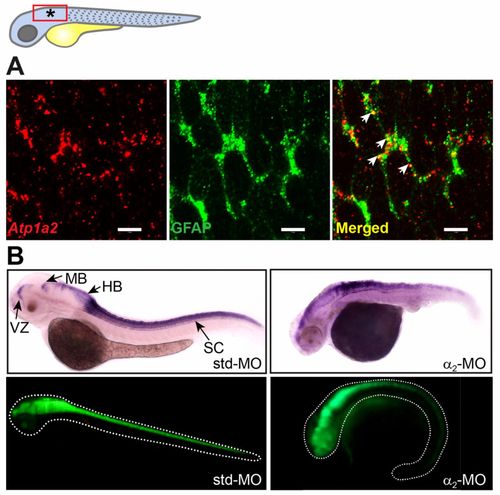
Atp1a2 expression colocalizes with GFAP, and Atp1a2 knockdown causes abnormal GFAP distribution. (A) Atp1a2 transcript colocalizes with the astrocytic marker GFAP in the embryonic zebrafish brain (region indicated by a red rectangle and an asterisk in the drawing). Transgenic embryos expressing GFP driven by the Gfap promoter were double stained using in situ hybridization for Atp1a2 (red fluorescence) in combination with anti-GFP immunostaining (green fluorescence). Arrows indicate Atp1a2/GFAP co-expressing cells, seen in yellow. (B) Distribution of Gfap transcripts, assessed by in situ hybridization, in std-MO- and α2-MO-injected embryos is distorted in α2-MO-injected embryos. Similarly, distribution of GFAP protein in Tg(Gfap:GFP) embryos is distorted by Atp1a2 knockdown. HB, hindbrain; MB, midbrain; SC, spinal cord; VZ, forebrain ventricular zone. Scale bars: 5μm. EXPRESSION / LABELING:
|
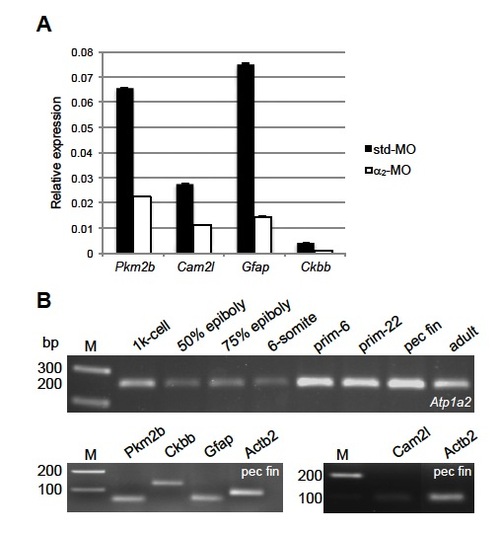
Relative expressions of some of the regulated proteins in Atp1a2-KD embryos and qRT-PCR products. (A) Relative expressions of Pkm2b, Cam2l, Gfap and Ckbb were quantified by qRT-PCR and normalized to Actb2. Data are presented as mean±s.e.m. of triplicate measurements. (B) 1% agarose gel run upon qRT-PCR illustrating PCR products migrated as expected. Atp1a2 (260 bp), Actb2 (86 bp), Cam2l (84 bp), Ckbb (124 bp), Gfap (63 bp) and Pkm2b (60 bp). EXPRESSION / LABELING:
|
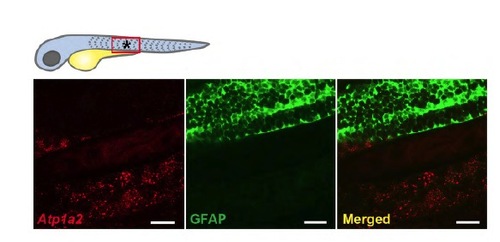
Atp1a2 and GFAP do not colocalize in the trunk. Transgenic embryos expressing GFP driven by the Gfap promoter were double stained by in situ hybridization for Atp1a2 (red fluorescence) in combination with anti-GFP immunostaining (green fluorescence). Atp 1a2 transcripts do not colocalize with GFAP in the embryonic zebrafish trunk. *area referring to Images. |

ZFIN is incorporating published figure images and captions as part of an ongoing project. Figures from some publications have not yet been curated, or are not available for display because of copyright restrictions. |
|
ZFIN is incorporating published figure images and captions as part of an ongoing project. Figures from some publications have not yet been curated, or are not available for display because of copyright restrictions. PHENOTYPE:
|