
|
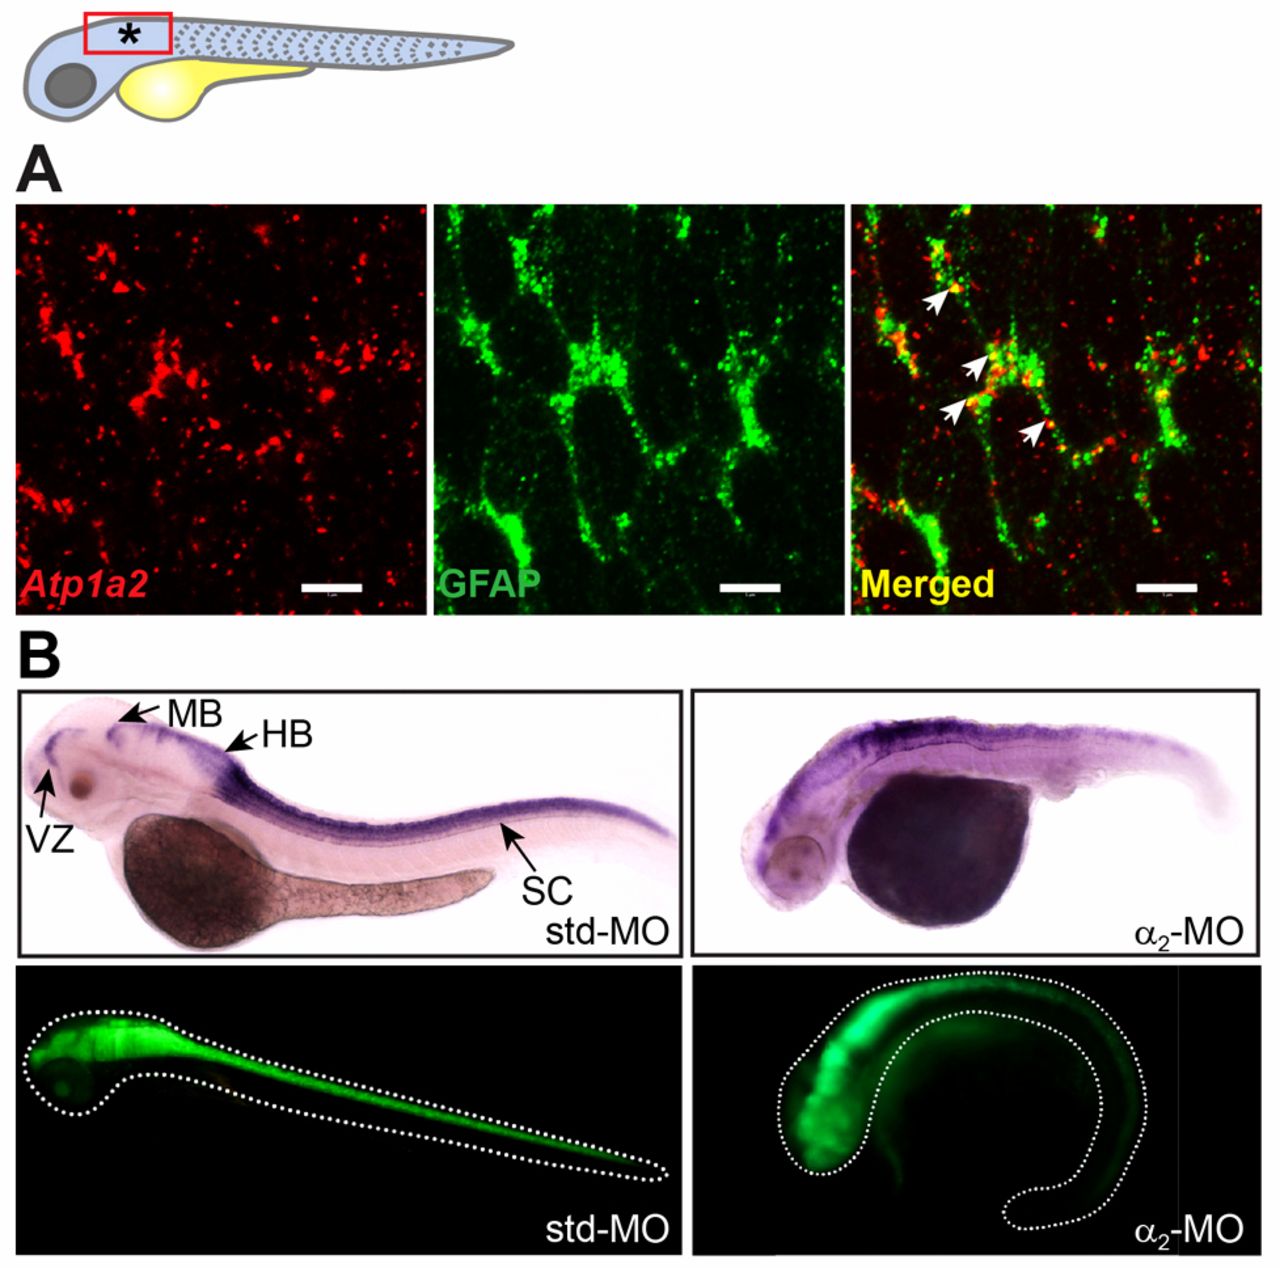
Fig. 5 Atp1a2 expression colocalizes with GFAP, and Atp1a2 knockdown causes abnormal GFAP distribution. (A) Atp1a2 transcript colocalizes with the astrocytic marker GFAP in the embryonic zebrafish brain (region indicated by a red rectangle and an asterisk in the drawing). Transgenic embryos expressing GFP driven by the Gfap promoter were double stained using in situ hybridization for Atp1a2 (red fluorescence) in combination with anti-GFP immunostaining (green fluorescence). Arrows indicate Atp1a2/GFAP co-expressing cells, seen in yellow. (B) Distribution of Gfap transcripts, assessed by in situ hybridization, in std-MO- and α2-MO-injected embryos is distorted in α2-MO-injected embryos. Similarly, distribution of GFAP protein in Tg(Gfap:GFP) embryos is distorted by Atp1a2 knockdown. HB, hindbrain; MB, midbrain; SC, spinal cord; VZ, forebrain ventricular zone. Scale bars: 5μm.