
|
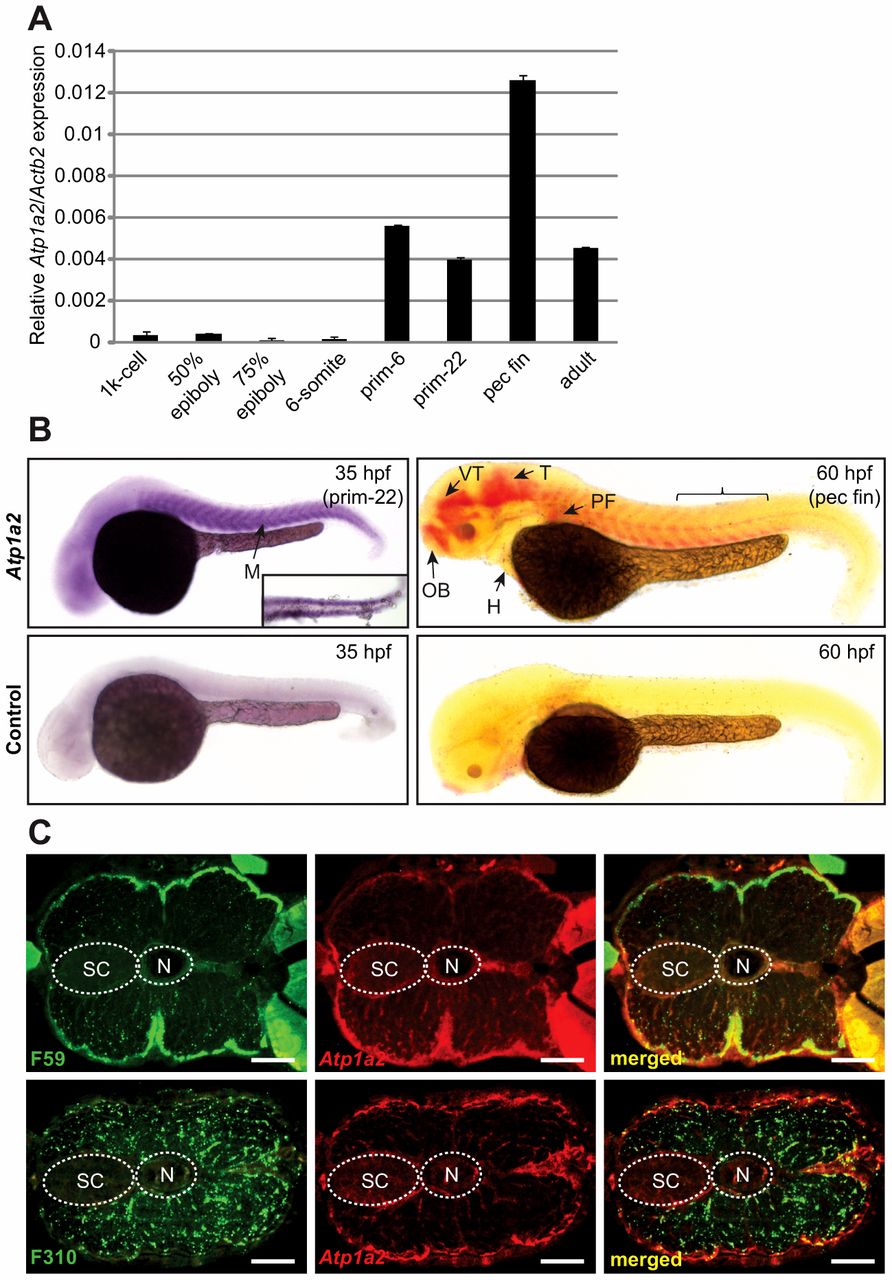
Fig. 1 Expression of Atp1a2 mRNA in zebrafish embryos. (A) Atp1a2 mRNA expression was quantified by qRT-PCR and normalized to Actb2. Data are presented as means ± s.e.m. of triplicate measurements. (B) Atp1a2 mRNA expression analyzed by whole-mount in situ hybridization in zebrafish embryos at 35 hpf (NBT/BCIP stained). The inset is a dorsal view of caudal staining at 35 hpf, and 60 hpf (Fast Red staining). Brackets indicate the position of the double-stained sections in C. Lower panel show sense probe negative controls. (C) Transverse sections of embryos double stained by in situ hybridization for Atp1a2 (red fluorescence) in combination with immunostaining using F310 (fast-twitch muscle) or F59 (primarily slow-twitch muscle; green fluorescence). H, heart; M, myotomes; N, notochord; OB, olfactory bulb; PF, pectoral fin; SC, spinal cord; T, midbrain tegmentum; VT, ventral thalamus. Scale bars: 100 μm.