
- Title
-
Cloning and expression of a zebrafish 5-HT(2C) receptor gene
- Authors
- Schneider, H., Fritzky, L., Williams, J., Heumann, C., Yochum, M., Pattar, K., Noppert, G., Mock, V., and Hawley, E.
- Source
- Full text @ Gene
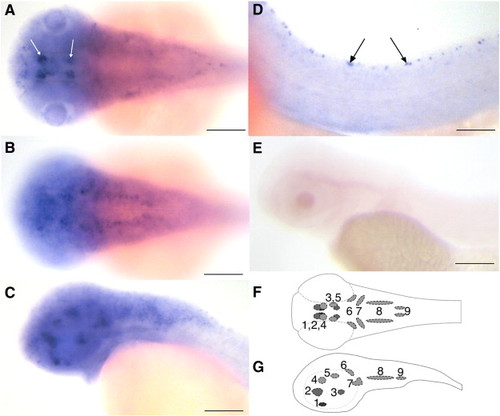
Expression of 5-HT2C receptor as detected in whole-mount in-situ hybridization preparations. A — top view of head, ventral focus, B — top view of head, dorsal focus, C — side view of head, D — side view of tail region, E — negative control staining (with sense RNA probe), F — organization of stained neuron clusters in top view, and G — organization of stained neuron clusters in side view. Accumulations of labeled cell bodies are visible in close proximity to and along the midline of the brain. In A, two labeled clusters (2 and 3, arrows) are labeled strongly. In B, the clusters in a more dorsal focal plane are not as intensively labeled as in A, but stained cells can be grouped into clusters 4–9 (see F and G). In D, the arrows indicate dorsal cell bodies in the spinal cord. (E) A sense probe against the 5′ end of the 5-HT2C receptor mRNA was used for the detection and did not yield any staining. The organization of stained neuron clusters 1–9 is depicted in F (top view) and G (side view). Ventral clusters are indicated in dark gray and dorsal clusters are indicated in light gray. Cluster designation: 1 — preoptic, 2 — ventral thalamus, 3 — posterior tuberculum, 4 — dorsal thalamus, 5- pretectum, 6 — dorsal tegmentum, 7 — ventral tegmentum, 8 — anterior medulla, 9 — posterior medulla. Scale bar in A–C, E — 120 μm; scale bar in D — 60 μm. EXPRESSION / LABELING:
|
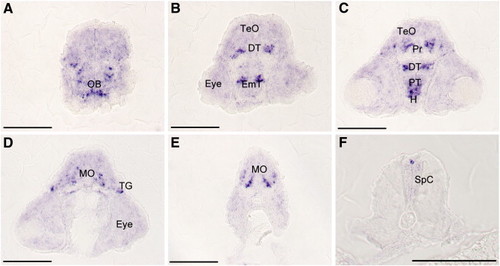
Expression of 5-HT2C receptor as detected in sectioned whole-mount in-situ hybridization preparations. A set of sections (10 μm) in an anterior to posterior sequence (A to F) from the same preparation is shown. Strong labeling of cell bodies is found in the olfactory bulb (OB in A), the dorsal thalamus (DT) and eminentia thalami (EmT) in a more posterior section (B). The strong staining of neurons in the pretectum (Pr), posterior tuberculum (PT) and hypothalamic area (H) is seen in C. A central cluster of cells stretches from the anterior to the posterior region of the medulla oblongata (MO in D and E). In the posterior region of the medulla, the cells are located in the ventral region and are organized in dorso-ventral stripes (E). (F) The spinal cord (SpC) shows labeling only in isolated pairs of cells at the dorsal tip of the spinal cord. TG — trigeminal ganglion. Scale bar 100 μm (A-E), 50 μm (F). EXPRESSION / LABELING:
|
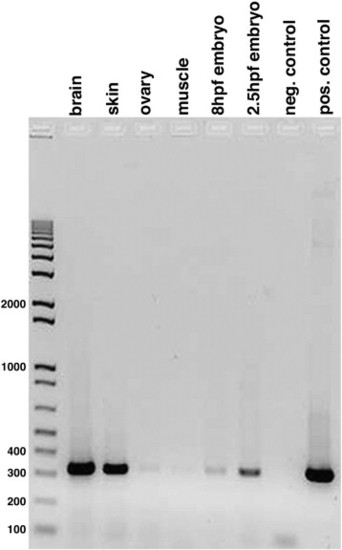
Expression profile of the zebrafish 5-HT2C receptor gene in different tissues generated by RT-PCR. A 310 bp fragment of the gene can be amplified from cDNA of zebrafish brain, skin, ovary, and axial muscle. The specific primers (KMXfwd/KMXrev) flank intron 4. Other tissues have not been tested. In addition, the receptor is expressed in 8 hpf and 2.5 hpf embryos. For the negative (neg) control, no cDNA was used for amplification. For the positive (pos) control, a plasmid containing the entire coding region of the receptor was used instead of cDNA. No quantitative approach was taken and the general intensity of individual fragments is not a direct indication of expression levels in individual tissues. |
Reprinted from Gene, 502(2), Schneider, H., Fritzky, L., Williams, J., Heumann, C., Yochum, M., Pattar, K., Noppert, G., Mock, V., and Hawley, E., Cloning and expression of a zebrafish 5-HT(2C) receptor gene, 108-117, Copyright (2012) with permission from Elsevier. Full text @ Gene