
- Title
-
The cytokine macrophage migration inhibitory factor (MIF) acts as a neurotrophin in the developing inner ear of the zebrafish, Danio rerio
- Authors
- Shen, Y.C., Thompson, D.L., Kuah, M.K., Wong, K.L., Wu, K.L., Linn, S.A., Jewett, E.M., Shu-Chien, A.C., and Barald, K.F.
- Source
- Full text @ Dev. Biol.
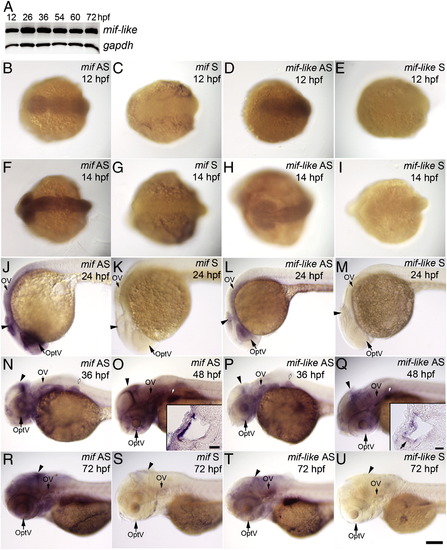
Expression of mif and mif-like transcripts in the brain, eye and ear during embryogenesis. (A) RT-PCR results of mif-like mRNA from whole embryos at 12, 26, 36, 54, 60, and 72 hpf. (B–U) Whole mount ISH with mif or mif-like probes. (B–E) Dorsal view of 12-hpf embryos; (F–I) Dorsal view of 14-hpf embryos; (J–M) Lateral view of 24-hpf embryos; (N, P) Lateral view of 36-hpf embryos; (O, Q) Lateral view of 48-hpf embryos; (R–U) Lateral view of 72-hpf larvae. (B, F, J, N, O, R) mif antisense probe; (C, G, K, S) mif sense probe; (D, H, L, P, Q, T) mif-like anti-sense probe; (E, I, M, U) mif-like sense probe. Insets in (O) and (Q) show transverse sections through the ear; the small arrow in inset (Q) indicates hair cells in the anterior macula. Arrowheads: brain; OptV: optic vesicle; OV: otic vesicle; white arrows with black outlines: pectoral fin bud. Scale bar: 100 μm for (B–U); 20 μm for insets. EXPRESSION / LABELING:
|
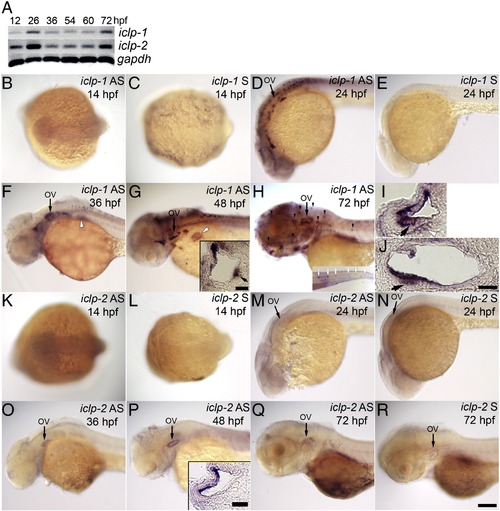
Expression patterns of embryonic iclp1 and iclp2. (A) RT-PCR results of iclp1 and iclp2 transcripts from whole embryos of 12, 26, 36, 54, 60, and 72 hpf. (B–H, K–R) Whole mount ISH with iclp1 (B–H) or iclp2 (K–R) probes. (B, C, K, L) Dorsal view of 14-hpf embryos; (D–H, M–R) Lateral view of (D, E, M, N) 24-hpf embryos; (F, O) 36-hpf embryos; (G, P) 48-hpf embryos; (H, Q, R) 72-hpf larvae. (B, D, F, G, H) with iclp1 antisense probe; (C, E) with iclp1 sense probe; (K, M, O, P, Q) with iclp2 antisense probe; (L, N, R) with iclp2 sense probe. (I, J) iclp1 labeling of 48 hpf embryo with transverse (I) and sagittal (J) sections. Arrows in (I) and (J) indicate hair cells in the anterior macula. Insets in (G) and (P) show transverse sections of the ear; Inset (G) inset shows a section through the posterior macula; small arrow in inset (G) indicates hair cells in the sensory patches. Inset (H) shows a tail with posterior LL neuromast staining. OV: otic vesicle. Arrowheads: anterior LL neuromasts; white arrows: posterior LL neuromasts; white arrows with black outlines: pectoral fin bud; white arrowhead with black outline: statoacoustic ganglion (SAG). Scale bar: 100 μm for (B–H) and (K–R); 20 μm for insets, (I) and (J). EXPRESSION / LABELING:
|
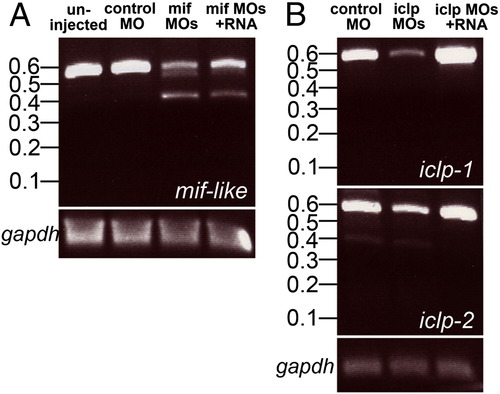
Morpholinos reduced the levels of normal transcripts of mif-like, iclp1, and iclp2. (A) RT-PCR of mif-like transcripts from uninjected, control MO injected, mif morpholinos injected and mif morpholinos plus capped RNAs injected 50-hpf embryos. Predicted size of normal transcript is 512 bp; predicted transcript blocked by mif-like MO = 336 bp. (B) RT-PCR of iclp1 and iclp2 transcripts from control MO-injected, iclp morpholinos injected and iclp morpholinos plus capped RNAs injected 50-hpf embryos. Predicted size of normal iclp1 product = 523 bp, transcript lacking exon 2 = 353 bp. Predicted size of normal iclp2 product = 525 bp, transcript lacking exon 2 = 364 bp. |
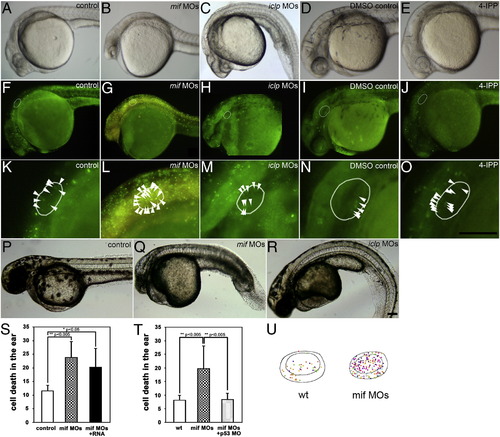
Gross morphology was affected by mif and iclp morpholinos. Lateral view of embryos at 29 hpf (A–E) and 48 hpf (P–R). (F–O) Acridine orange (AO) staining demonstrated cell death in 29-hpf embryos. (K–O) Magnified ear area in (F–J) respectively. (A, F, K, P) control; (B, G, L, Q) mif morphants; (C, H, M, R) iclp morphants; (D, I, N) DMSO control; (E, J, O) 4-IPP (40 μM)-treated embryos. White oval outlines indicate the positions of the otocysts; white arrowheads point to the AO-stained cells in the otocysts. (S, T) Comparison of AO-stained cells in the inner ear (n = 4 for each treatment in (S), and n = 5 for wt, 8 for both mif MOs and mif MOs + p53 MO in (T)) at 29 hpf. (U) Illustration of the location of AO-positive cells in the otocyst. The different colors of the spots represent AO-positive cells in the different embryos assessed. They are superimposed in this figure to determine if cells in a particular region were more susceptible (n = 5 for wild type, and 8 for mif morphants). Scale bar: 100 μm. |
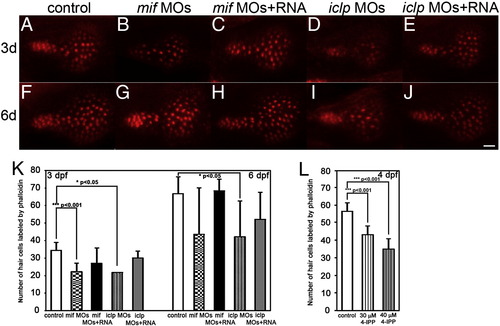
Phalloidin staining of the sensory hair patch showed defects in mif and iclp morphants. (A–J) Phalloidin staining of saccular macula with 3d (A–E) and 6d (F–J) larvae. Anterior is to the left. (K) Numbers of HC labeled by phalloidin at 3 dpf (n = 9 for control, 10 for mif morphants, 13 for mif morphants with RNA rescue, 2 for iclp morphants, 6 for iclp morphants with capped RNA) and 6 dpf (n = 4 for control, 7 for mif morphants, 3 for mif morphants with RNA rescue, 5 for iclp morphants, 6 for iclp morphants with capped RNA). (L) Numbers of HC labeled by phalloidin at 4 hpf (n = 14 for DMSO control, 9 for 30 μM 4-IPP, 12 for 40 μM 4-IPP treatment). Scale bar: 10 μm. PHENOTYPE:
|
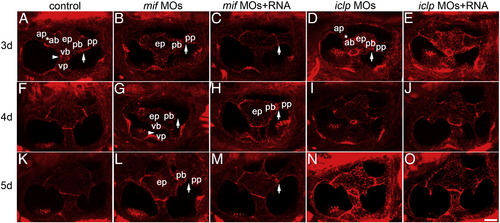
Semicircular canal formation in mif and iclp morphants. (A–O) phalloidin staining of epithelial pillars (ep), which form hubs of the developing SCC. (A–E) 3 dpf; (F–J) 4 dpf; (K–O) 5 dpf larvae. (A, F, K) control; (B, G, L) mif morphants; (C, H, M) mif morphants with capped mif RNAs; (D, I, N) iclp morphants; (E, J, O) iclp morphants with capped iclp RNAs. Anterior is to the left. Arrows: junction of the posterior bulge (pb) and posterior protrusion (pp). Arrowheads: junction between the ventral bulge (vb) and ventral protrusion (vp). Stars: junction of the anterior protrusion (ap) and the anterior bulge (ab). In mif morphants, a gap between the pb and the pp was observed, indicating fusion failure. Scale bar: 25 μm. n = 11 for the 3 dpf control, 12 for the 3 dpf mif morphants, 4 for the 3 dpf mif MOs + RNA. Among the 12 mif morphants, 9 had defects in SCC formation (75%). n for 4 dpf is 7 for the controls, 6 for the mif morphants, 6 for the mif MOs + RNA, 11 for the iclp morphants, 5 for the iclp MOs + RNA. Four out of 6 (67%) mif morphants had SCC defects. For 5 dpf larvae, n = 6 for control, 7 for mif morphants, 7 for mif MOs + RNA, 5 for iclp morphants, 6 for iclp MOs + RNA. Eighty six percent (6 out of 7) mif morphants had SCC defects. PHENOTYPE:
|

Statoacoustic ganglion in the mif, iclp morphants and 4-IPP treated embryos. (A–F) Whole mount in situ hybridization of embryos with an nkx5.1 probe, showing the otic vesicle and SAG at 32 hpf. (A) control embryo; (B) mif morphant; (C) mif morphant with RNA; (D) iclp1 morphant; (E, F) 4-IPP treated (E: 30 μM, F: 40 μM) embryos. (G–K) zn-5 staining in 48-hpf embryos. (G) control; (H) mif morphant; (I) mif morphant with capped mif RNAs; (J) iclp morphant; (K) iclp morphant with capped iclp RNAs. The white line outlines the SAGs. Note other cranial ganglia were also smaller in the mif morphants than the control. gAD: anterodorsal LL ganglia. Scale bar: 25 μm. (L) Comparison of size of the SAG with various treatments. Control embryos (n = 30), mif MOs (n = 14), mif MOs + RNA (n = 12), iclp MOs (n = 17), and iclp MOs + RNA (n = 15). |
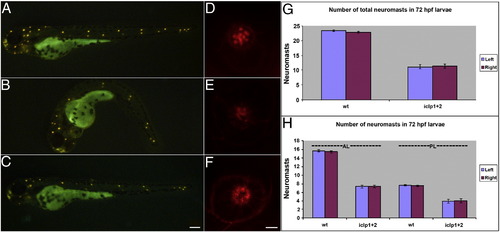
Development of lateral line (LL) in iclp morphants. (A–C) 4-Di-2-ASP staining of 72-hpf control (A), iclp morphant (B), and iclp morphant with capped RNAs (C). (D–F) Phalloidin staining of posterior LL neuromast at 5 dpf in control (D), iclp MOs-injected (E), and iclp MOs plus RNA-injected (F) larvae. Scale bar: 100 μm for (A–C), 5 μm for (D–E). (G, H) Comparison of numbers of neuromast stained with 4-Di-2-ASP in control larvae and iclp morphants. Wt (n = 10), MO (n = 15). PHENOTYPE:
|
Reprinted from Developmental Biology, 363(1), Shen, Y.C., Thompson, D.L., Kuah, M.K., Wong, K.L., Wu, K.L., Linn, S.A., Jewett, E.M., Shu-Chien, A.C., and Barald, K.F., The cytokine macrophage migration inhibitory factor (MIF) acts as a neurotrophin in the developing inner ear of the zebrafish, Danio rerio, 84-94, Copyright (2012) with permission from Elsevier. Full text @ Dev. Biol.