
- Title
-
Two-color fluorescent in situ hybridization in the embryonic zebrafish brain using differential detection systems
- Authors
- Lauter, G., Soll, I., and Hauptmann, G.
- Source
- Full text @ BMC Dev. Biol.
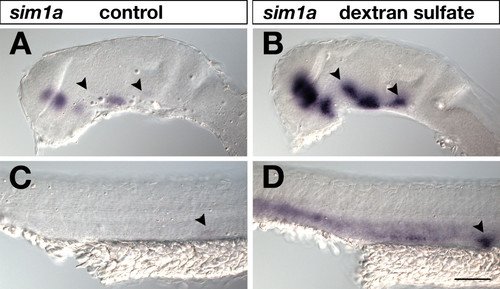
Effects of dextran sulfate in standard WISH. 24-hpf embryos were hybridized to a sim1a digoxigenin-labeled RNA probe, which was visualized by AP-BCIP/NBT chromogenic detection under identical conditions and staining times. Lateral views of embryonic brains (A,B) and trunks (C,D) are shown with anterior to the left. In (B,D) but not in (A,C) 5% dextran sulfate was included in the hybridization buffer. Addition of dextran sulfate resulted in increased signal sensitivity. Arrowheads in (A,B) indicate sim1a-positive neuronal clusters identified in dextran sulfate treated brains (B) that were hardly detected in untreated embryos (A). Arrowheads in (C,D) mark the pronephric primordium strongly visualized in dextrane sulfate treated embryos (D) but not in untreated specimens (C). Embryos were viewed on an Axioplan II microscope and images were recorded with an Axiocam digital camera. Scale bar is 100 μm. |

Effects of hydrogen peroxide and dextran sulfate on Fast Red and Fast Blue detection. 24-hpf embryos were hybridized to a shha dinitrophenyl-labeled RNA probe, which was visualized by AP-Fast Blue (A-D) or AP-Fast Red (E-H) chromogenic staining for 55 min and 80 min, respectively. Lateral views of embryonic brains are shown with anterior to the left. On top of each panel it is indicated whether embryos were permeabilized with 2% hydrogen peroxide (H2O2) and whether 5% dextran sulfate (dextran-s) was added to the hybridization buffer. Strongest signals were obtained when hydrogen peroxide treated embryos were hybridized in the presence of dextran sulfate (D,H). Embryos were viewed on an Axioplan II microscope and images were recorded with an Axiocam digital camera. Scale bar is 100 μm. |

Fast Red and Fast Blue permit chromogenic and fluorescent transcript visualization. Lateral views of embryonic brains at 24 hpf hybridized to nkx6.1 digoxigenin and/or pax6a dinitrophenol antisense RNA probes as indicated on each panel. Transcript distributions were visualized by chromogenic (A,C,E) or fluorescent (B,D) detection of Fast Blue (C,D,E) and Fast Red (A,B,E) precipitates as indicated. Embryos were viewed on an Axioplan II microscope and images were recorded with an Axiocam digital camera. Fluorescent signals were false-colored in ImageJ. Scale bar is 100 μm. |

Control of bleed-through between Fast Red and TSA-FAM detection channels. 24-hpf embryos were hybridized to a dinitrophenol-labeled pax6a probe (A,B) or to a digoxigenin-labeled antisense RNA probe specific for nkx6.1 (C,D). Transcripts were detected using Fast Red (A,B) and TSA-FAM (C,D). Fluorescence signals were recorded in the Fast Red (Ch01: detection of wavelengths greater than 560 nm) and TSA-FAM (Ch02: detection of wavelengths from 505 nm to 545 nm) detection channels. A significant bleed-through of TSA-FAM nkx6.1 signal was detected in the Fast Red detection channel (C). Lateral views with anterior to the left are shown. Images were recorded on a LSM510 confocal microscope and false-colored in ImageJ. Scale bar is 50 μm. |

Control of bleed-through between Fast Blue and TSA-FAM detection channels. 24-hpf embryos were hybridized to a dinitrophenol-labeled pax6a probe (A,B) or to a digoxigenin-labeled antisense RNA probe specific for nkx6.1 (C,D). Transcripts were detected using Fast Blue (A,B) and TSA-FAM (C,D). Fluorescence signals were recorded in the Fast Blue (Ch01: detection of wavelengths greater than 650 nm) and TSA-FAM (Ch02: detection of wavelengths from 505 nm to 545 nm) detection channels. No bleed-through was detected between the TSA-FAM and Fast Blue detection channels (B,C). Lateral views with anterior to the left are shown. Images were recorded on a LSM510 confocal microscope and false-colored in ImageJ. Scale bar is 50 μm. |

Two-color FISH by combining POD and AP detection systems. 24-hpf embryos were simultaneously hybridized to differently-labeled pax6a and nkx6.1 probes and visualized by sequential recording of TSA-FAM (B,C,E,F) and Fast Red (A,C) or Fast Blue (D,F). Single channels (A,B,D,E) and overlays of two channels (C,F) are shown. Detection channels for Fast Blue, Fast Red and TSA-FAM were >650 nm, >560 nm, and 505 nm to 545 nm, respectively. Dotted lines indicate boundaries of basal part of prosomere 1. Abbreviations: b1, basal part of prosomere 1; b2, basal part of prosomere 2; m, midbrain; p1, prosomere 1; p2, prosomere 2, p3 prosomere 3; pr, pretectum; pt, prethalamus; t, telencephalon; th, thalamus. Images were recorded on a LSM510 confocal microscope and false-colored in ImageJ. Scale bar is 50 μm. |