
- Title
-
Evolutionary plasticity of segmentation clock networks
- Authors
- Krol, A.J., Roellig, D., Dequéant, M.L., Tassy, O., Glynn, E., Hattem, G., Mushegian, A., Oates, A.C., and Pourquié, O.
- Source
- Full text @ Development
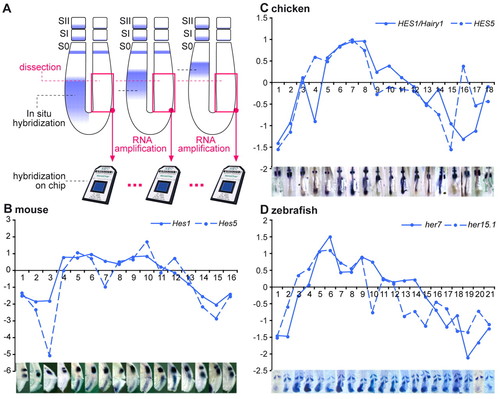
Identification of cyclic genes from mouse, chicken and zebrafish using microarray time series. (A) Experimental procedure. The right posterior half of the presomitic mesoderm (PSM) was surgically removed from zebrafish, chicken or mouse embryos. Total RNA was extracted, amplified and hybridized to Affymetrix microarrays. Dissected embryos were ordered along one segmentation clock cycle using the position of cyclic gene expression domains [Lfng mouse and chicken, her7 zebrafish, detected by in situ hybridization (ISH)] along the anteroposterior axis of the left PSM. The microarrays corresponding to the dissected samples were ordered accordingly. (B-D) Microarray expression profiles of the known cyclic genes Hes1 and Hes5 for mouse (B) and chicken (C) and her7 and her15 for zebrafish (D) and corresponding ISH of the dissected embryos (bottom). The x-axis corresponds to the sample number and the y-axis to the log2 ratios of the expression profiles. |
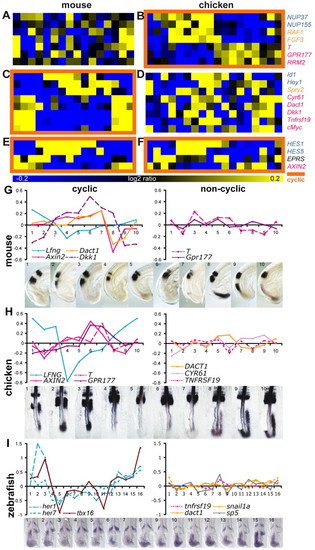
Lack of conservation of individual cyclic genes between mouse and chicken embryos. (A-F) Comparison of genes identified as non-cyclic in mouse (A) but cyclic in chicken (B) and of genes cyclic in mouse (C) but not in chicken (D). Also shown are genes cyclic both in mouse (E) and chicken (F). Orange squares highlight cyclic gene expression time series. Pathway association of candidate cyclic genes is indicated in blue (Notch), orange (FGF) and magenta (Wnt). (G-I) qPCR expression profiles (y-axis, log2 ratio of ΔCt; x-axis, sample number) of cyclic and non-cyclic genes for mouse (G), chicken (H) and zebrafish (I), and ISH of known cyclic genes on dissected embryos used for the qPCR. |
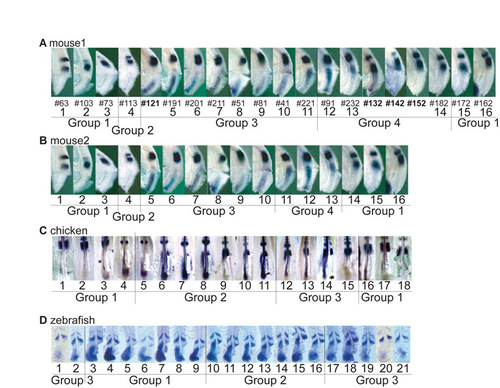
Embryo assignment to local time windows for permutation analysis. It is often difficult, based on the in situ pattern, to decide whether an embryo oscillation phase is more advanced compared with that of another embryo that shows a closely related staining. We therefore divided the microarray series into groups, within which the relative position of embryos was hard to determine, thereby defining local time windows. Images of the embryos used in the microarray experiments and the groups corresponding to the local time windows used for the permutation analysis are shown for (A) mouse1, (B) mouse2, (C) chicken and (D) zebrafish. |
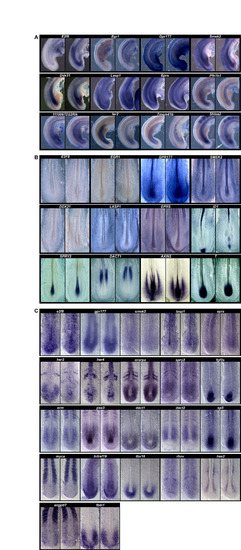
ISH expression pattern analysis of candidate cyclic genes or orthologs of candidate cyclic genes. ISH images for (A) 2-day-old (stage 12HH) chicken embryos, (B) 9.5 dpc mouse embryos and (C) 10- to 15-somite stage zebrafish embryos. |