
Fig. 6
- ID
- ZDB-FIG-120330-20
- Publication
- Krol et al., 2011 - Evolutionary plasticity of segmentation clock networks
- Other Figures
- All Figure Page
- Back to All Figure Page
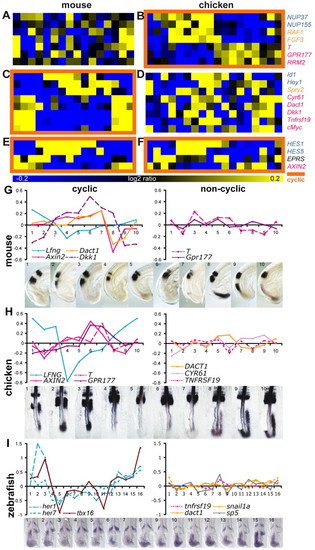
Lack of conservation of individual cyclic genes between mouse and chicken embryos. (A-F) Comparison of genes identified as non-cyclic in mouse (A) but cyclic in chicken (B) and of genes cyclic in mouse (C) but not in chicken (D). Also shown are genes cyclic both in mouse (E) and chicken (F). Orange squares highlight cyclic gene expression time series. Pathway association of candidate cyclic genes is indicated in blue (Notch), orange (FGF) and magenta (Wnt). (G-I) qPCR expression profiles (y-axis, log2 ratio of ΔCt; x-axis, sample number) of cyclic and non-cyclic genes for mouse (G), chicken (H) and zebrafish (I), and ISH of known cyclic genes on dissected embryos used for the qPCR. |