
|
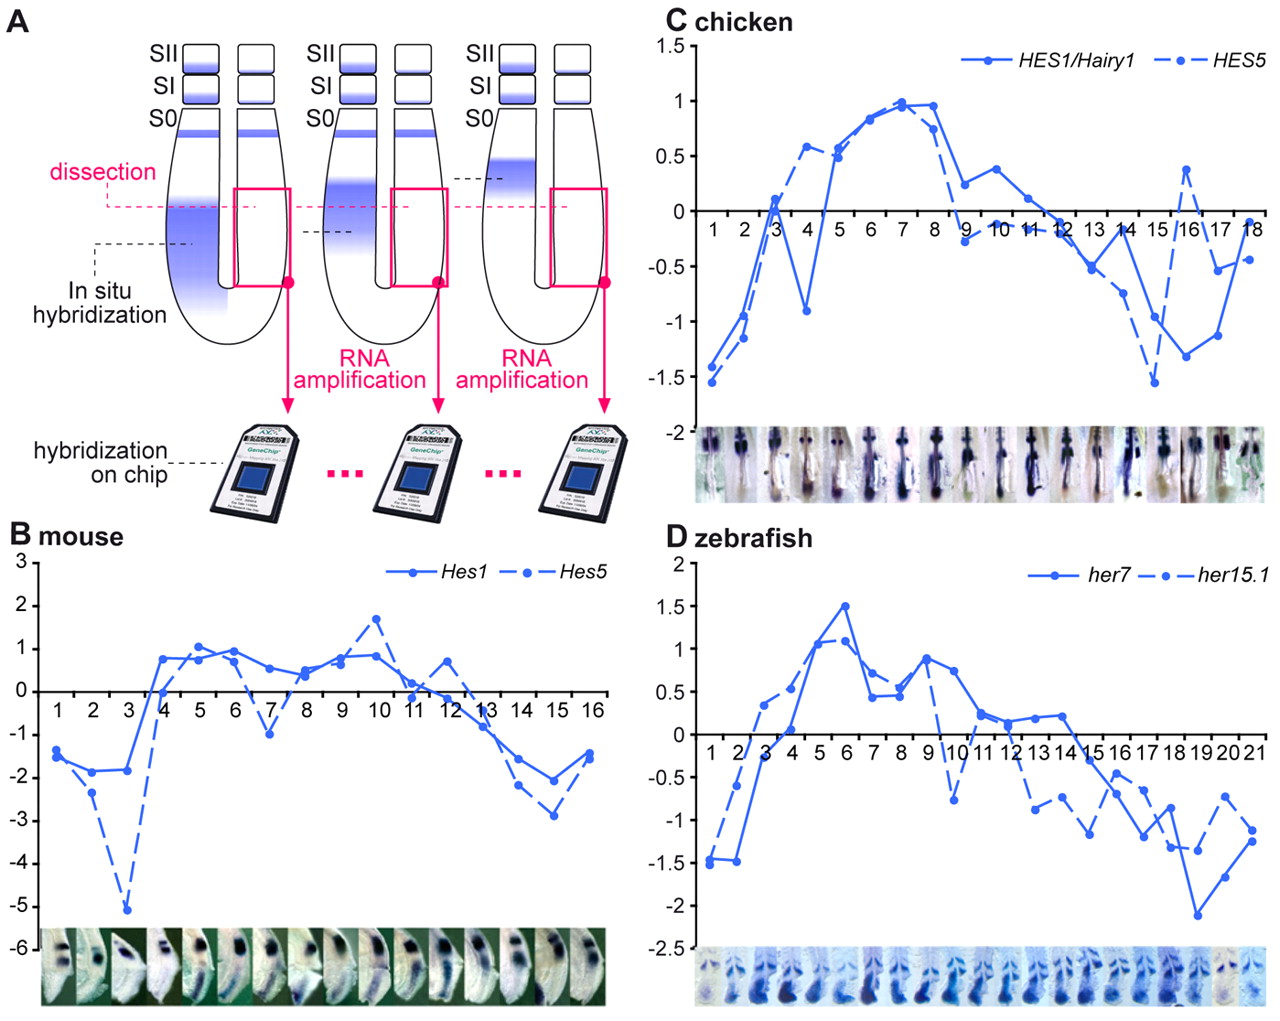
Fig. 1 Identification of cyclic genes from mouse, chicken and zebrafish using microarray time series. (A) Experimental procedure. The right posterior half of the presomitic mesoderm (PSM) was surgically removed from zebrafish, chicken or mouse embryos. Total RNA was extracted, amplified and hybridized to Affymetrix microarrays. Dissected embryos were ordered along one segmentation clock cycle using the position of cyclic gene expression domains [Lfng mouse and chicken, her7 zebrafish, detected by in situ hybridization (ISH)] along the anteroposterior axis of the left PSM. The microarrays corresponding to the dissected samples were ordered accordingly. (B-D) Microarray expression profiles of the known cyclic genes Hes1 and Hes5 for mouse (B) and chicken (C) and her7 and her15 for zebrafish (D) and corresponding ISH of the dissected embryos (bottom). The x-axis corresponds to the sample number and the y-axis to the log2 ratios of the expression profiles.