
- Title
-
Adaptation of GAL4 activators for GAL4 enhancer trapping in zebrafish
- Authors
- Ogura, E., Okuda, Y., Kondoh, H., and Kamachi, Y.
- Source
- Full text @ Dev. Dyn.
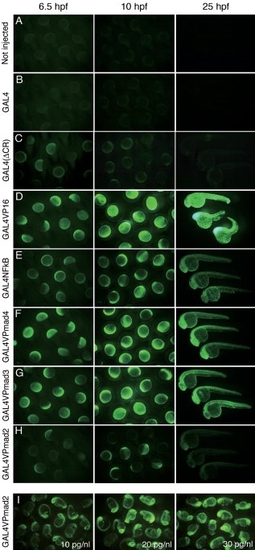
Figure 2. Comparison of transactivation potentials and deleterious effects of the variant GAL4 activators in zebrafish embryos. A–H: nlsVenus expression and morphology of embryos injected with the variant GAL4 activator mRNAs. Homozygous UAS:nlsVenus reporter embryos were injected at the one-cell stage with approximately 1 nl solution containing the activator mRNAs (5 pg/nl) and observed at 6.5, 1, and 25 hpf. Native GAL4 mRNA was injected at 13.5 pg/nl, which was equimolar to 5 pg/nl of GAL4VP16. I: GAL4VPmad2 mRNA was injected at concentrations of 10, 20, and 30 pg/nl. The fluorescent images were captured with fixed exposure times of 2, 1.5, and 1 sec at 6.5, 10, and 25 hpf, respectively. Representative images were taken from at least two independent injections, which gave consistent results. |
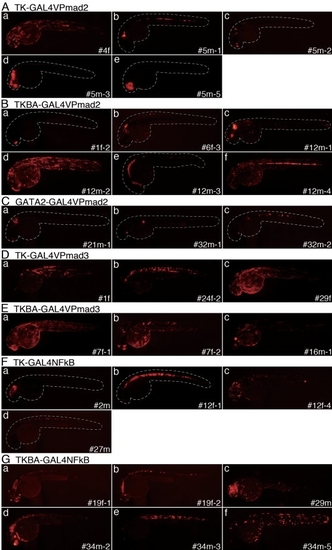
Figure 4. Patterns of UAS:DsRedExDR reporter expression in enhancer-trap lines with modified GAL4 activators. A–G: DsRedExDR expression patterns observed at 30–36 hpf for selected enhancer-trap lines are shown grouped according to the specific trap constructs. In Be, a 24-hpf embryo is presented for its clear reporter expression at this stage. In some panels, the embryo is outlined. A short description of the expression patterns for selected enhancer-trap lines is presented in Table 2. |
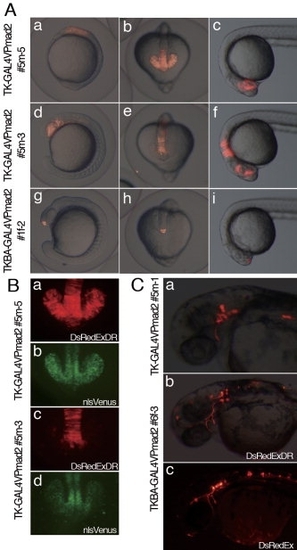
Figure 5. Spatio-temporal reporter expression patterns generated by variant GAL4 activators in selected enhancer-trap lines. A: UAS:DsRedExDR expression in embryos of the TK-GAL4VPmad2 #5m-5 (a–c), #5m-3 (d–f), and TKBA-GAL4VPmad2 #1f-2 (g–i) lines at 11 hpf (a), 15 hpf (b,d,e,g,h), and 24 hpf (c,f,i). Lateral views of whole embryos (a,d,g). Dorsal views of whole embryos (b,e,h). Lateral views with anterior to the left (c,f,i). B: UAS:nlsVenus expression in the TK-GAL4VPmad2 #5m-5 line (b) and the TK-GAL4VPmad2 #5m-3 line (d) at 15 hpf is shown for comparison with UAS:DsRedExDR expression (a,c). Dorsal views with anterior to the bottom. C: Higher magnification images of TK-GAL4VPmad2 #5m-1 (a) and TKBA-GAL4VPmad2 #6f-3 (b,c) highlighting neuronal expression at 36 hpf. The UAS:DsRedEx line was used to obtain brighter red fluorescence in the embryo shown in c. Dorsolateral (a,b) and lateral (c) views of the head region. EXPRESSION / LABELING:
|
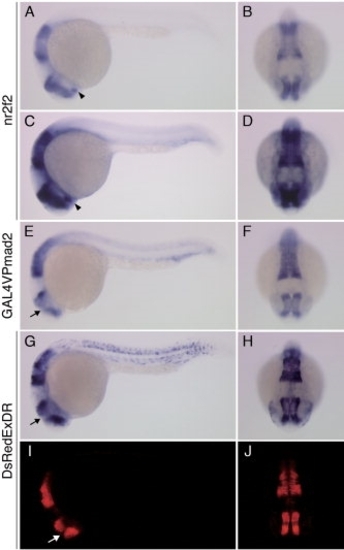
Figure 6. Comparison of expression patterns among the nr2f2 gene, the GAL4VPmad2 activator, and the UAS-linked reporter transcript and its fluorescence in the TK-GAL4VPmad2 #5m-3 line. A–H: Whole-mount in situ hybridization for detecting nr2f2, GAL4VPmad2, and DsRedExDR mRNAs at 24 hpf. The specimens in C and D were processed for color development four times longer than A and B in order to visualize nr2f2 expression in the spinal cord. I,J: DsRedExDR fluorescence in a TK-GAL4VPmad2 #5m-3 embryo at 24 hpf. EXPRESSION / LABELING:
|
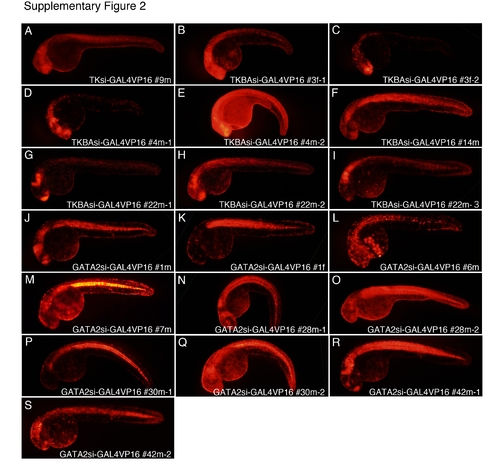
Supp. Fig. 2. GAL4VP16 expressed by trapped endogenous enhancers strongly activates UAS:DsRedExDR reporter expression, but disrupts normal development. A–S: F1 embryos derived from crossing of the GAL4VP16 enhancer-trap founders with the UAS:DsRedExDR reporter line demonstrated strong DsRedExDR reporter expression at 30 to 36 hpf. In these F1 embryos, two classes of DsRedExDR-expression were recognized: strong, region-specific expression, and weak, widespread expression. The first class of DsRedExDR expression probably resulted from trapped enhancer-dependent GAL4VP16 expression because crossing with different driver fish led to unique expression patterns. The second class of DsRedExDR expression was likely caused by low-level GAL4VP16 expression mediated by the basal promoter activity in the transgene. GAL4VP16-positive F1 embryos except TKBAsi-GAL4VP16#14m did not survive beyond 5 dpf. Note that the embryos showing the most intense reporter expression levels were often already malformed (B,E,N,P,Q). |
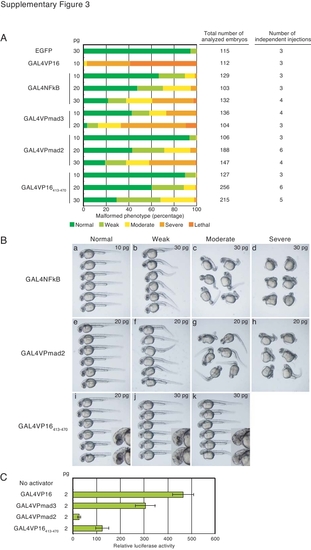
Supp. Fig. 3. Comparison of the toxicity and transactivation potentials of the variant GAL4 activators including GAL4VP16413-470 in zebrafish embryos. A: Comparison of the toxicity levels of the various GAL4 activators. The indicated GAL4 activator mRNAs (10, 20, or 30 pg) were injected into one- to two-cell-stage embryos (TL line) and morphological abnormalities at 28–30 hpf were classified according to their severity into five groups: normal, weakly malformed, moderately malformed, severely malformed, and lethal phenotypes. The affected tissues varied depending on the activators as shown in B. EGFP mRNA (30 pg) was also injected as a control. B: Typical morphologies for each phenotypic class. GAL4NFkB (a, 10 pg; b–d, 30 pg), GAL4VPmad2 (e–h, 20 pg), and GAL4VP16413-470 (i, 20 pg; j,k, 30 pg). Because GAL4VP16413-470 caused defects in the eye and the anterior CNS (insets of j, k) without significantly affecting posterior development, the anterior phenotype was mainly used as a criterion of phenotypic classes. C: Comparison of the transactivation potentials of GAL4VP16, GAL4VPmad3, GAL4VPmad2, and GAL4VP16413-470. Co-injection of GAL4 activator mRNAs (2 pg) with the UAS:Venusluc reporter vector was carried out as described in Figure 3. A low amount of activator mRNAs was used, as the adverse effects of GAL4VP16 are negligible at this expression level. |