
- Title
-
Id2a influences neuron and glia formation in the zebrafish retina by modulating retinoblast cell cycle kinetics
- Authors
- Uribe, R.A., and Gross, J.M.
- Source
- Full text @ Development
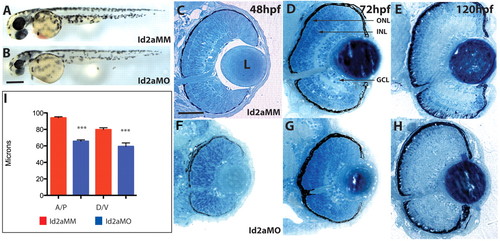
Id2a knockdown results in microphthalmia and defects in retinal lamination. (A,B) Id2a-MM-injected (control) (A) and Id2a-MO-injected (B) zebrafish embryos at 48 hpf display a reduction in eye and brain size. (C-H) Transverse histological sections of Id2a-MM and Id2a-MO retinas at 48 (C,F), 72 (D,G) and 120 (E,H) hpf. Id2a-MO eyes are smaller than Id2a-MM eyes, and the inner nuclear layer (INL) and outer nuclear layer (ONL) are not morphologically identifiable in Id2a-MO retinas at 72 hpf (G). (I) Measurements of absolute eye size along the anteroposterior (A/P) and dorsoventral (D/V) axes at 48 hpf. n=6 embryos; ***, P<0.001. Error bars indicate ± s.e.m. Dorsal is up in all images. GCL, ganglion cell layer; L, lens. Scale bars: 150 μm in A,B; 80 μm in C-H. |
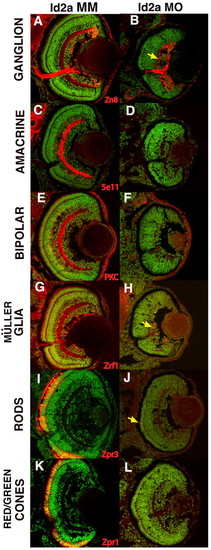
Id2a is required for the differentiation of late-born retinal neurons and Müller glia. Immunohistochemical analysis of markers (red) of neuronal and glial differentiation in Id2a-MM and Id2a-MO zebrafish embryos at 72 hpf. (A,B) Ganglion cells (zn8), (C,D) amacrine cells (5e11), (E,F) bipolar cells (PKC), (G,H) Müller glia (zrf1), (I,J) rods (zpr3) and (K,L) red/green cones (zpr1). Although Id2a-MO retinas contain ganglion cells (B) and an occasional rod cell (J, arrow) or Müller glia cell (H, arrow), all late differentiated cell types are absent. DNA, green. EXPRESSION / LABELING:
PHENOTYPE:
|
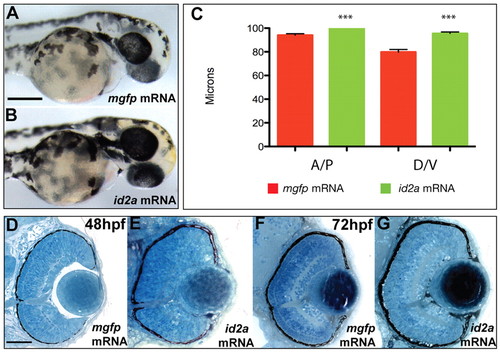
Overexpression of Id2a leads to macrophthalmia but does not affect retinal lamination. (A,B) mgfp mRNA-injected (control) (A) and id2a mRNA-injected (B) zebrafish embryos at 48 hpf. Approximately 58% of embryos injected with id2a mRNA exhibit enlarged eyes compared with embryos injected with mgfp mRNA. (C) Quantification of eye size in mgfp mRNA-injected and id2a mRNA-injected embryos at 48 hpf. n=5 embryos; **, P=0.015. (D-G) Transverse histological sections of mgfp mRNA and id2a mRNA-injected embryos at 48 (D,E) and 72 (F,G) hpf. The id2a mRNA retina at 48 hpf (E) is noticeably larger than the mgfp mRNA-injected control (D). Retinal lamination is normal at both time points. Error bars indicate ± s.e.m. Scale bars: 150 μm in A,B; 80 μm in D-G. |
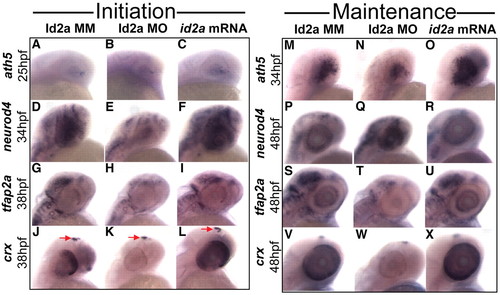
Changes in Id2a levels alter the expression of neurogenic factors involved in retinal cell fate specification. (A-X) Lateral views of whole-mount in situ hybridizations detecting the initiation (A-L) and maintenance (M-X) of the indicated genes at the indicated time points in Id2a-MM, Id2a-MO and id2a-overexpressing zebrafish embryos. Pineal body expression of crx is indicated by arrows in J-L. |
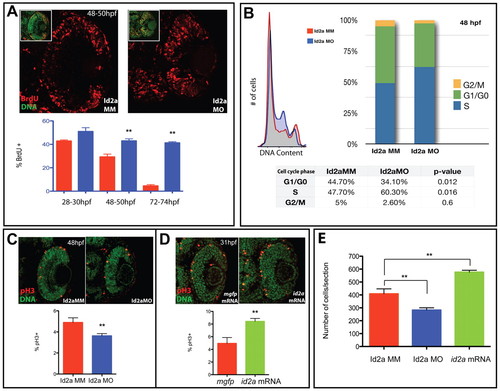
Id2a is required for S-phase progression and is sufficient to enhance retinoblast mitotic activity. (A) BrdU exposures from 28-30, 48-50 and 72-74 hpf reveal an increased proportion and mislocalization of S-phase cells in Id2a-MO retinas compared with Id2a-MM retinas. n=4 retinas; **, P<0.05. Insets are examples of SYTOX Green/BrdU overlays used for cell counts. (B) FACS DNA-content analysis of Id2a-MM and Id2a-MO retinas indicates that Id2a-MO retinal cells contain an increased percentage of retinoblasts in S phase, concomitant with decreases in G0/G1 and G2/M (data averaged from three independent experiments). (C) pH3 localization in Id2a-MM and Id2a-MO retinas at 48 hpf. n=5 retinas; **, P<0.05. (D) pH3 in mgfp mRNA-injected and id2a-overexpressing retinas at 31 hpf. Id2a-MO retinas contain a lower percentage of mitotic cells and id2a-overexpressing retinas contain a higher percentage than controls. n=5 retinas; **, P<0.05. (E) Average cell numbers in Id2a-MM, Id2a-MO and id2a-overexpressing retinas. n=4 retinas; **, P<0.05. Error bars indicate ± s.e.m. PHENOTYPE:
|
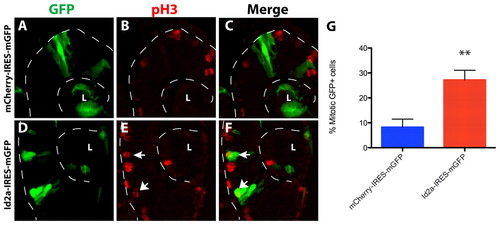
Clonal overexpression of id2a is sufficient to enhance retinoblast mitoses. (A-F) Confocal micrographs of transverse immunosections from heat shock-induced mCherry-IRES-mGFP (A-C) and Id2a-IRES-mGFP (D-F) zebrafish embryos at 34 hpf. GFP+ cells that were pH3+ (arrows in E,F) were counted. The lens (L) and posterior boundary of the optic cup are outlined (dashed lines). Dorsal is up in all images. (G) The percentage of mitotic GFP+ cells from control mCherry-expressing cells and id2a-expressing cells. **, P=0.0012. Error bars indicate ± s.e.m. |
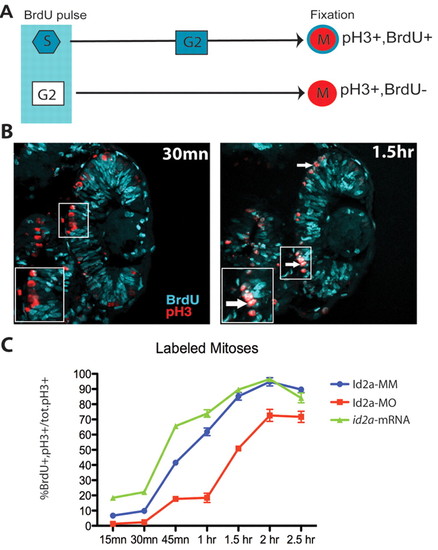
Id2a modulates the progression between S and M phase in proliferating retinoblasts. (A) Schematic of the percent labeled mitoses (PLM) paradigm. A 15-minute BrdU pulse marks S-phase retinoblasts, which then progress to M phase over time. Detection of M-phase cells with pH3 identifies those that were in S phase at the time of BrdU exposure. (B) Control retinas showing BrdU incorporation (cyan) and pH3 staining (red) at 30 minutes and 1.5 hours post-exposure. Many S-phase cells have progressed to M phase within 1.5 hours and are detected by BrdU/pH3 co-labeling (inset, arrow). (C) Graphical representation of PLM from 15 minutes to 2.5 hours post-exposure. Id2a-MO cells are delayed in progressing from S to M phase at all time points examined (n=4 retinas; **, P<0.003), whereas at 15 minutes, 30 minutes and 1 hours post-exposure, id2a-overexpressing retinoblasts have progressed from S to M phase more rapidly (n=4 retinas; **, P<0.025). PHENOTYPE:
|
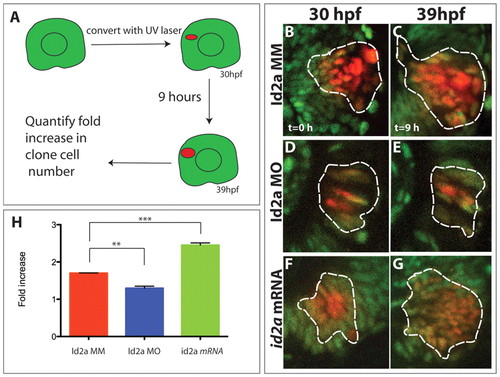
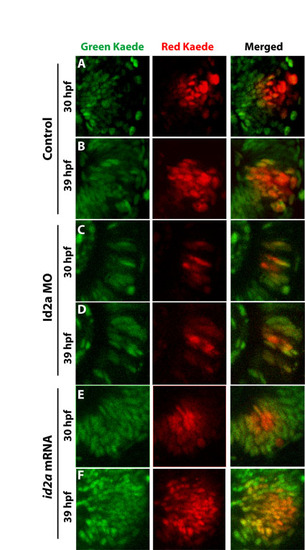
Id2a levels modulate retinoblast proliferation in vivo. (A) Kaede clonal analysis paradigm. (B-G) Clonal expansion between 30 and 39 hpf in Id2a-MM (B,E), Id2a-MO (C,F) and id2a mRNA retinas (D,G). Projections from confocal z-stacks with the approximate position of each clone outlined. (H) Quantification of fold increase in cell number per clone (n=3 retinas). Id2a-MM clones exhibit a 1.7-fold increase in cell number, Id2a-MO clones exhibit a 1.29-fold increase (**, P=0.0019), and id2a-overexpressing clones exhibit a 2.45-fold increase (***, P=0.002) over time. Error bars indicate ± s.e.m. |

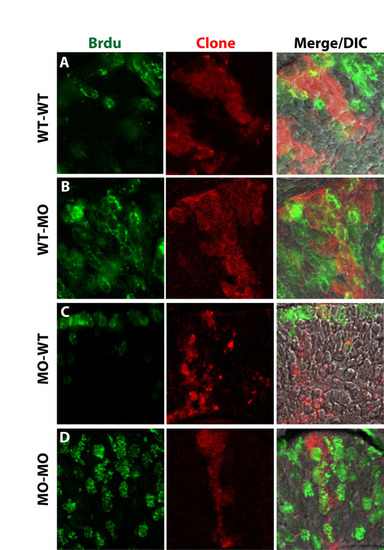
Id2a downstream function in mediating retinoblast cell cycle progression is non-cell-autonomous. (A) Schematic of experiment. Biotin-dextran lineage-labeled donor cells were transplanted into shield-stage host zebrafish embryos, then mosaic embryos were pulsed with BrdU at 48 hpf to assay cell cycle exit. Clones on the ventral side of the central retina were analyzed. (B) Transplanted cells (red) and BrdU+ cells (green). Top left, wild-type (WT) cells in a WT host; top right, WT cells in an Id2a-MO host; bottom left, Id2a-MO cells in an Id2a-MO host; bottom right, Id2a-MO cells in a WT host. Arrows indicate an example of a BrdU+ cell within a clone. (C) Quantification of the percentage of BrdU+ cells per clone. n=4-5 clones per condition; **, P<0.001; ***, P<0.0003. |

Id2a downstream function in mediating neuronal differentiation is non-cell-autonomous. Ventral retinal clones (red) at 61 hpf stained for zpr1 (blue) immunoreactivity in (A) WT-WT, (B) MO-WT, (C) WT-MO and (D) MO-MO mosaics. Dashed line, outer plexiform layer; asterisks, transplanted cells differentiated as red/green cones. |

id2b expression and Id2a morpholino (MO) controls. Zebrafish possess two id2 paralogs, id2a and id2b. (A,B) id2b mRNA is not detected in the retina at 24 hpf (A), whereas at 48 hpf small clusters of cells are positive for id2b (B, arrows). (C,D) Id2 is expressed throughout the neuroepithelial retina and lens at 24 hpf (C) and becomes restricted to the dorsal CMZ by 48 hpf (D). (E,F) Id2 protein is not detected at 24 hpf (E) or at 48 hpf (F) in Id2a morphant retinas. (G) Western blot confirmation of Id2 antibody specificity and MO knockdown. Id2 antibody recognizes a specific band at 15 kDa from 48 hpf larval lysates. MO-mediated knockdown of Id2a leads to reductions in the specific -15 kDa band, whereas MO knockdown of Id2b does not. |

Cell cycle progression and retinal differentiation can be rescued following Id2a knockdown. (A-D) Red/green cone cell distribution in the retinas of Id2a-MM (A), Id2a-MO (B), 85 pg id2a mRNA (C) and Id2a-MO plus 85 pg id2a mRNA (D) at 72 hpf. (E-H) Localization of BrdU+ cells in the retinas of Id2a-MM (E), Id2a-MO (F), 85 pg id2a mRNA (G) and Id2a-MO plus 85 pg id2a mRNA (H) at 72 hpf. (I) Quantification of the proportion of BrdU+ cells in A-E. **, P<0.05; ***, P<0.005. Scale bar: 50 μm. |

Id2a is not required for the specification of retinal progenitor identity. (A-H) Between 14 and 16 hpf, the expression domains of both Id2a-MM (A-D) and Id2a-MO (E-H) embryos are shown for pax6 (A,E), sox2 (B,F), six3b (C,G) and mab21lb (D,H). (I,J) At 24 hpf, the expression of six3b (I) and sox2 (J) is also shown in Id2a-MM and Id2a-MO embryos. Although the eye field expression domains are slightly smaller in Id2a morphants, the expression patterns of these progenitor identity markers are normal compared with Id2a-MM embryos. |

Loss of Id2a leads to a failure to restrict the expression of pcna and ccnd1 in the developing retina. (A-D) Cryosections reveal the expression domains of pcna at 34 hpf (A,B) and ccnd1 at 48 hpf (C,D) in Id2a-MM retinas and Id2a-MO retinas, respectively. At 34 hpf, the expression of pcna remains high throughout the peripheral margins of the eye, whereas in Id2a-MO retinas expression remains strong throughout the central retina. Similarly, the expression of ccnd1 remains strong at 48 hpf throughout the Id2a-MO retina (D), whereas its expression in the Id2a-MM retina (C) is restricted to the peripheral margins of the eye. |
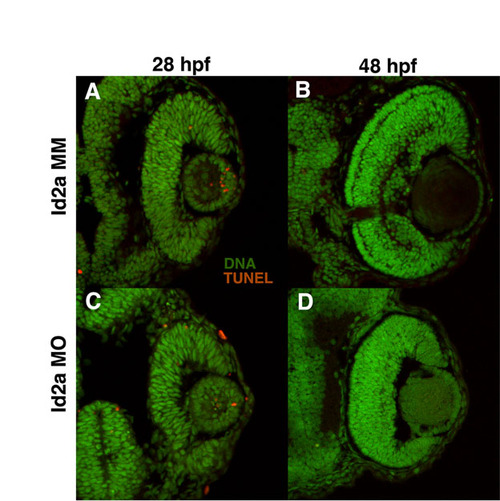
Loss of Id2a does not lead to increases in cell death. Cryosections showing TUNEL-positive cells (red) and DNA (green) in Id2a-MM retinas at (A) 28 hpf and (B) 48 hpf and Id2a-MO retinas at (C) 28 hpf and (D) 48 hpf. The number of TUNEL-positive cells in Id2a-MO retinas at both time points is not increased compared with the Id2a-MM control. |
Id2a influences retinoblast cell cycle kinetics in vivo. Single-channel and merged confocal projections are shown for the localization of unconverted (green) and converted (red) Kaede protein at 30 and 39 hpf in (A,B) live control, (C,D) Id2a-MO and (E,F) id2a mRNA retinas. |
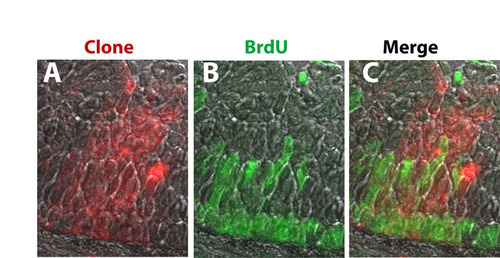
Id2a functions non-cell-autonomously for cell cycle exit in the developing retina. Single-channel and merged images of clones (red), BrdU incorporation (green) and overlay on a DIC image (merge) for (A) WT-WT, (B) WT-MO, (C) MO-WT and (D) MO-MO. |
Mosaic analysis of large morphant to wild-type clones. (A-C) Id2a-MO clones of more than 30 cells behave as morphants when placed in a wild-type host. A large Id2a-MO clone revealed in red (A), and its BrdU incorporation (B) are shown merged (C) at 48 hpf. |