
Image
|
Figure Caption
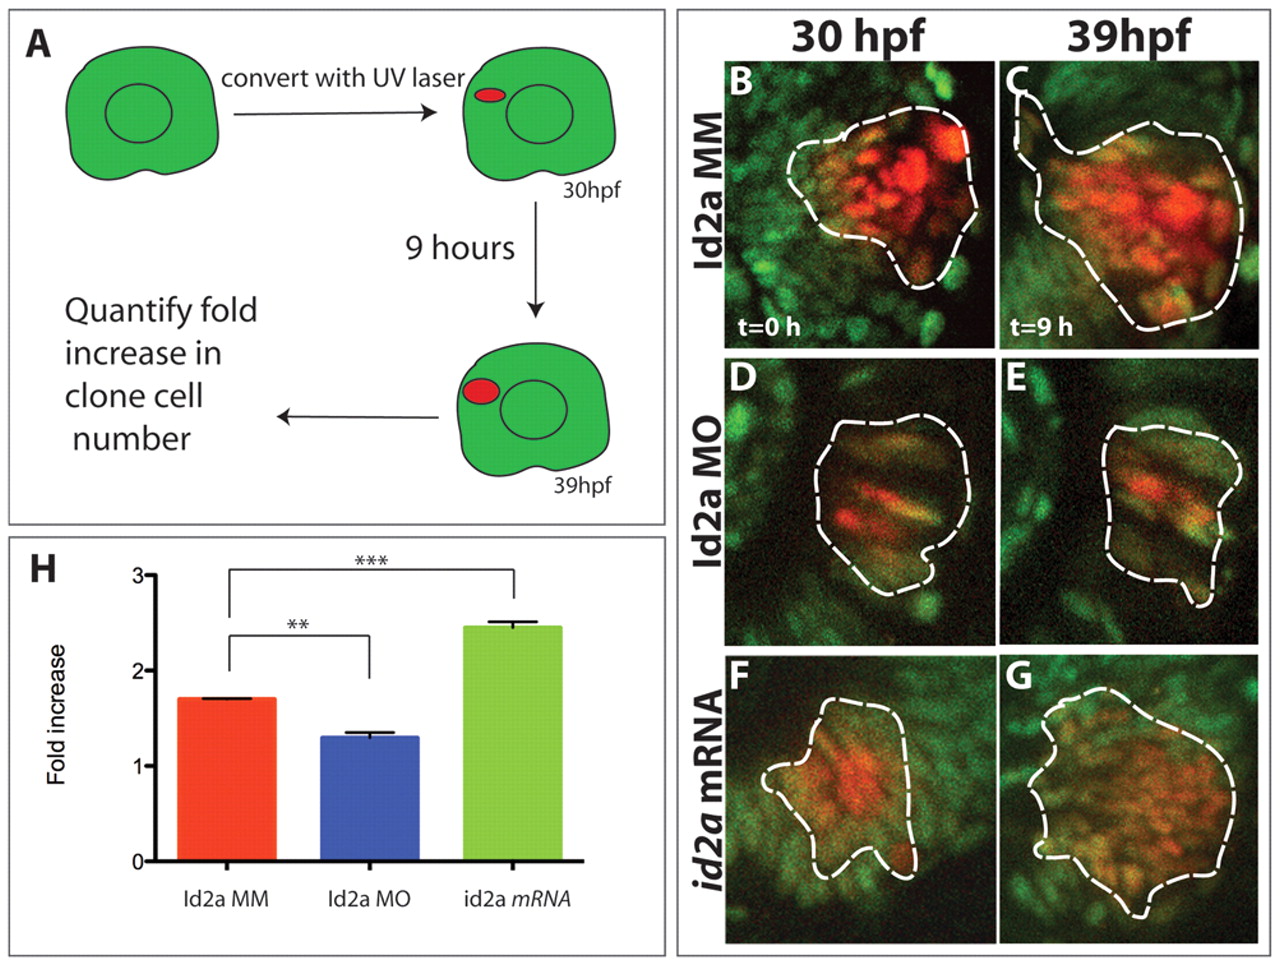
Fig. 8 Id2a levels modulate retinoblast proliferation in vivo. (A) Kaede clonal analysis paradigm. (B-G) Clonal expansion between 30 and 39 hpf in Id2a-MM (B,E), Id2a-MO (C,F) and id2a mRNA retinas (D,G). Projections from confocal z-stacks with the approximate position of each clone outlined. (H) Quantification of fold increase in cell number per clone (n=3 retinas). Id2a-MM clones exhibit a 1.7-fold increase in cell number, Id2a-MO clones exhibit a 1.29-fold increase (**, P=0.0019), and id2a-overexpressing clones exhibit a 2.45-fold increase (***, P=0.002) over time. Error bars indicate ± s.e.m.
Acknowledgments
This image is the copyrighted work of the attributed author or publisher, and
ZFIN has permission only to display this image to its users.
Additional permissions should be obtained from the applicable author or publisher of the image.
Full text @ Development