
- Title
-
Mutations in N-cadherin and a Stardust homolog, Nagie oko, affect cell-cycle exit in zebrafish retina
- Authors
- Yamaguchi, M., Imai, F., Tonou-Fujimori, N., and Masai, I.
- Source
- Full text @ Mech. Dev.
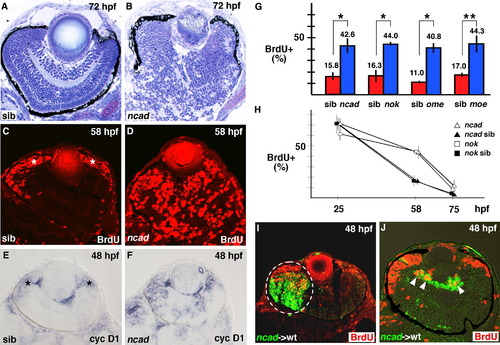
Ratio of number of proliferating cells to total number of retinal cells increases in zebrafish cell-polarity-defective mutants. (A and B) Plastic sections of 72 hpf wild-type retina (A) and ncad mutant retina (B). The laminar structure is severely disorganized in the ncad mutant retina. (C and D) BrdU labeling of 58 hpf wild-type retina (C) and ncad mutant retina (D). BrdU-positive cells (red) are located in CMZ of wild-type retinas (C, asterisks), whereas many retinal cells are BrdU-positive even in the central region of ncad mutant retinas (D). (E and F) In situ hybridization of 48 hpf wild-type retina (E) and ncad mutant retina (F) using cyclin D1 RNA probe. cyclin D1 is expressed in CMZ of wild-type retinas (E, asterisks), whereas it is expressed in not only CMZ but also the central region of ncad mutant retinas (F). (G) Percentage of BrdU-positive cells with respect to total number of retinal cells at 58 hpf in retinal-cell-polarity-defective mutants: ncad, nok, ome, and moe (blue bars) and their wild-type siblings (red bars). The ratio of BrdU-positive cells is 2.7 times higher in ncad, nok, and moe mutants and 3.7 times higher in the ome mutant than in their siblings. Student’s t-test; *p < 0.005 and **p < 0.01. (H) Temporal profile of the percentage of BrdU-positive cells with respect to total number of retinal cells in nok (open squares) and ncad (open triangles) embryos and their wild-type sibling embryos (filled squares and triangles). The percentage is higher in these mutants than in wild-type siblings at 58 hpf, but decreased to the wild-type level by 75 hpf. The difference between the ncad/nok mutants and their siblings is not significant (Student’s t-test, p > 0.05) at both 25 and 75 hpf, but significant (Student’s t-test p < 0.05) at 58 hpf. (I and J) Cell-transplantation experiments of ncad mutant donor cells into wild-type recipient retinas. A large clone of mutant cells forms very close to CMZ of the wild-type retina (I) and a small clone forms in the vitrial region of the neural retina (J). In both cases, ncad mutant cells (green) abnormally incorporate BrdU (red) in wild-type recipient retinas [white dashed circle (I) and arrowheads (J)]. |
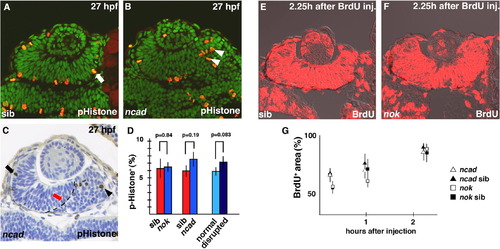
Cell-cycle progression is not altered in ncad and nok mutant retinas at the early stage of retinal neurogenesis. (A and B) Labeling of 27 hpf wild-type retina (A) and ncad mutant retina (B) with anti-pH3 antibody. Dorsal is to the left. In the wild-type retina, pH3-positive cells (red) are located in the ventricular zone (A, arrow), whereas pH3-positive cells fail to associate with the ventricular zone but are abnormally positioned in the ncad mutant retina (B, arrowheads). All the nuclei are stained with Sytox green. (C) Plastic section of 27 hpf ncad mutant retina labeled with anti-pH3 antibody (brown). Dorsal is to the left. All the nuclei are counterstained with toluidine blue. pH3-positive cells are localized at the apical surface of the neural retina in the dorsal cell-polarity normal area (arrow), but detached from the apical surface in the ventral cell-polarity compromised area (arrowhead). The boundary between the cell-polarity-normal region and the cell-polarity-compromised region is very distinct (dashed line) and considered to correspond to a part of AJs detached from the pigmented epithelium (see Fig. 4 in Masai et al., 2003). It is noted that pH3-positive cells are sometimes positioned along the interface in the cell-polarity-normal region (red arrow). These cells are counted as normal polarized cells. (D) Percentage of number of pH3-positive cells with respect to total number of cells in wild-type retina (red bars) and nok and ncad mutant retinas (blue bars), and in cell-polarity-normal region (light blue bar) and cell-polarity-compromised region (dark blue bar) within ncad mutant retina. Statistical analyses were carried out by Student’s t-test. (E and F) BrdU labeling of wild-type retina (E) and nok mutant retina (F) that incorporated BrdU within 2 h 15 min. Approximately 85% of the retinal cells were labeled in wild type and nok mutant retinas. (G) Temporal profile of percentage of BrdU-positive area with respect to total retinal area in ncad (open triangles) and nok mutant (open squares) retinas and their wild-type sibling retinas (filled triangles and squares). The profiles of wild-type retinas and these mutant retinas are similar (Student’s t-test; p > 0.05). PHENOTYPE:
|
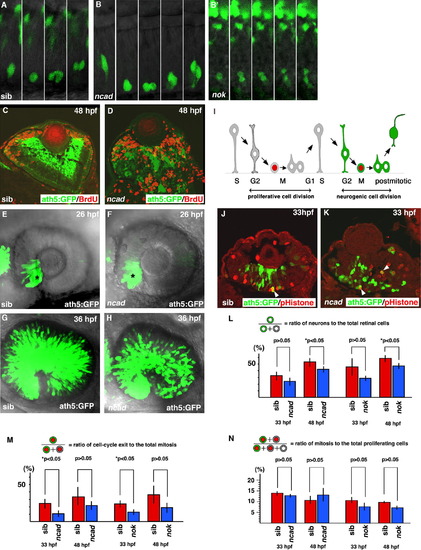
Cell-cycle exit of retinal cells is compromised in ncad and nok mutants. (A, B, and B′) Time lapse images of ath5:GFP expression in wild-type retina (A), ncad (B) and nok (B′) mutant retinas from 30 (the leftmost panel) to 36 hpf (the rightmost panel). The apical surface of the retinal epithelium is positioned nearly at the bottom of each panel. ath5:GFP expression (green) is initiated in the G2 phase in retinal progenitor cells undergoing the final cell division and inherited by two post-mitotic daughter cells in wild-type embryos and ncad and nok mutant embryos. In the nok mutant retina shown in (B′), the cell-division plane was nearly perpendicular to the apicobasal direction, which is very rare in the wild type. (C and D) Double labeling of wild-type retina (C) and ncad mutant retina (D) with anti-BrdU antibody (red) and ath5:GFP (green). BrdU and ath5:GFP expressions do not overlap in both the wild-type retina and ncad mutant retina. (E and F) Expression of ath5:GFP in wild-type retina (E) and ncad mutant retina (F) at 26 hpf. The initial induction of ath5:GFP in the ventronasal retina (asterisks) occurs at almost the same stage as in the wild-type retina and ncad mutant retina. (G and H) ath5:GFP expression in the same pair of wild-type retina and ncad mutant retina shown in (E and F) at 36 hpf. ath5:GFP expression spreads similarly in ncad mutant retinas. (I) Schematic drawing of cell division, interkinetic nuclear migration, and molecular markers, ath5:GFP (green) and pH3 (red), in the neural retina. Retinal cells undergoing the neurogenic cell division are both ath5:GFP- and pH3-positive, whereas retinal cells undergoing the proliferative cell division are pH3-positive but ath5:GFP-negative. (J and K) Double labeling of wild type (J) and ncad mutant retinas (K) with anti-pH3 antibody (red) and ath5:GFP (green). Double positive cells are in yellow (arrowheads). (L) Percentage of ath5:GFP-positive cells with respect to total number of cells in wild-type retina and ncad and nok mutant retinas. The percentage is significantly decreased in these mutant retinas at 48 hpf (Student’s t-test, *p < 0.05). (M) Percentage of pH3- and ath5:GFP-double-positive cells with respect to total number of pH3-positive cells in wild-type retina and ncad and nok mutant retinas. The percentage is significantly decreased in ncad and nok mutant retinas at 33 hpf (Student’s t-test, *p < 0.05). (N) Percentage of pH3-positive cells with respect to total number of “pH3-positive cells plus ath5:GFP- and pH3-double-negative cells” in wild-type retina and ncad and nok mutant retinas. There is no significant difference between wild-type retinas and these mutant retinas (Student’s t-test, p > 0.05). |
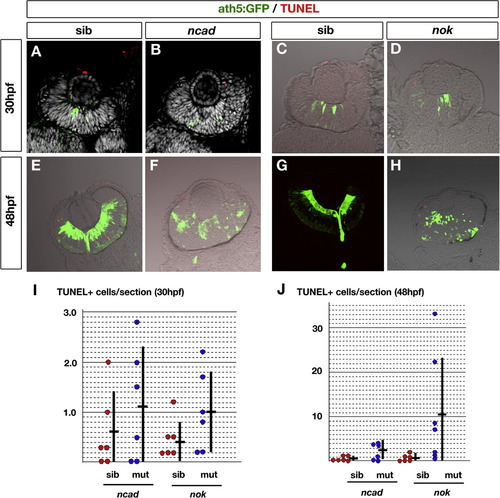
TUNEL of ncad and nok mutant retinas at 30 and 48 hpf. (A–D) Labeling with ath5:GFP (green) and TUNEL (red) of 30 hpf retinas in ncad (B) and nok (D) mutants and their wild-type siblings (A and C). All nuclei were counterstained with DAPI (white) (A and B). (E–H) Labeling with ath5:GFP (green) and TUNEL (red) of 48 hpf retinas in ncad (F) and nok (H) mutants and their wild-type siblings (E and G). (I and J) Histogram of number of TUNEL-positive cells per sectioned retina in ncad and nok mutants (blue circles) and their wild-type siblings (red circles) at 30 hpf (I) and 48 hpf (J). Each circle represents the average number of TUNEL-positive cells per sectioned retina for a single embryo, which was calculated using six sections prepared from both the left and right eyes. Means (short horizontal bars) and standard deviations (vertical bars) were calculated using six different embryos. The number of TUNEL-positive cells per sectioned retina vary in the nok mutant retinas at 48 hpf, and the difference between the nok mutant and its wild-type sibling retinas was p = 0.078 for Student’s t-test and p = 0.026 for the Mann–Whitney test. Although the difference was not found to be significant by Student’s t-test (p > 0.05), the level of apoptosis seems to be higher in nok mutant retina than in the wild type at 48 hpf. There is no significant difference between the ncad mutant and its wild-type sibling retinas at 30 and 48 hpf, and between nok mutant and its wild-type sibling retinas at 30 hpf (Student’s t-test, p > 0.05). |
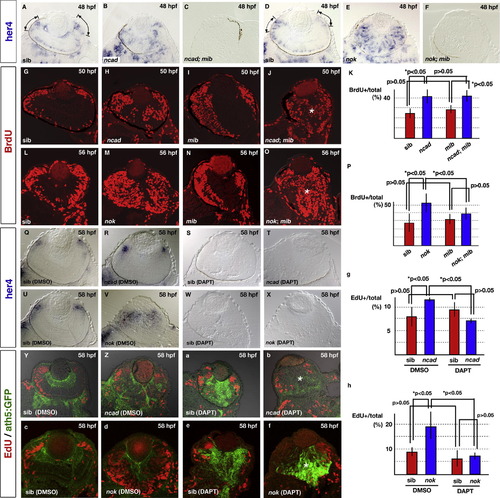
Neurogenic defects in the ncad and nok mutant retinas depend on the Notch signaling pathway. (A–F) Expression of her4 mRNA in 48 hpf retinas of ncad (B), ncad; mib (C), nok (E), and nok; mib (F) mutants and their wild-type siblings (A and D). her4 mRNA is expressed in the central part of CMZ of wild-type retinas (A and D, lines and arrows). On the other hand, a patchy pattern of her4 expression is observed in the central region in ncad (B) and nok mutant retinas (E). her4 mRNA expression level is markedly reduced in the ncad; mib (C) and nok; mib mutant retinas (F). (G–J) BrdU labeling of wild-type retina (G) and ncad (H), mib (I), and ncad; mib mutant retinas (J) at 50 hpf. BrdU incorporation is observed in CMZ of the wild type and mib mutant retinas, whereas the central retina is BrdU-positive in the ncad and ncad; mib mutants, suggesting that mib mutation does not efficiently suppress BrdU incorporation in the central retina of ncad mutants (J, asterisk). (K) Ratio of number of BrdU-positive cells to total number of retinal cells in wild-type sibling retina and ncad, mib, and ncad; mib mutant retinas. The higher level of BrdU incorporation in the ncad mutant retina is not decreased by mib mutation. (L–O) BrdU labeling of wild-type retina (L) and nok (M), mib (N), and nok; mib mutant retinas (O) at 56 hpf. BrdU incorporation is observed in CMZ of the wild type and mib mutant retinas, whereas the central retina is BrdU-positive in the nok and nok; mib mutants (O, asterisk). (P) Ratio of number of BrdU-positive cells to total number of retinal cells in wild-type sibling retinas and nok, mib, and nok; mib mutant retinas. The higher level of BrdU incorporation in the nok mutant retina is partially decreased by mib mutation. (Q–T) her4 mRNA expression in wild-type sibling retina (Q) and ncad mutant retina (R) treated with DMSO, and in wild-type sibling retina (S) and ncad mutant retina (T) treated with DAPT at 58 hpf. At this stage, her4 mRNA expression level decreases in the central retina and the expression is observed only in CMZ of the ncad mutant retina (R). her4 mRNA expression is completely absent in both the wild-type retina and ncad mutant retina treated with DAPT (S and T). (U–X) her4 mRNA expression in wild-type sibling retina (U) and nok mutant retina (V) treated with DMSO, and in wild-type sibling retina (W) and nok mutant retina (X) treated with DAPT at 58 hpf. In contrast to the ncad mutant, her4 mRNA expression is observed in the central retina as well as CMZ of the nok mutant (V). her4 mRNA expression is completely absent in both wild-type and nok mutant retinas treated with DAPT (W and X). (Y and Z, a and b) ath5:GFP expression (green) and EdU incorporation (red) in wild-type sibling retina (Y) and ncad mutant retina (Z) treated with DMSO, and in wild-type sibling retina (a) and ncad mutant retina (b) treated with DAPT at 58 hpf. EdU incorporation is suppressed but ath5:GFP expression is observed in the central retina of the ncad mutant treated with DAPT (asterisk in b). (c–f) ath5:GFP expression (green) and EdU incorporation (red) in wild-type sibling retina (c) and nok mutant retina (d) treated with DMSO, and in wild-type sibling retina (e) and nok mutant retina (f) treated with DAPT at 58 hpf. EdU incorporation is suppressed but ath5:GFP expression is observed in the central retina of the nok mutant treated with DAPT (asterisk in f). (g) Ratio of number of EdU-positive cells to total number of retinal cells in wild-type sibling retina and ncad mutant retinas treated with DAPT or DMSO. The higher level of EdU incorporation in the ncad mutant retina was decreased by DAPT treatment. (h) Ratio of number of EdU-positive cells to total number of retinal cells in wild-type sibling retina and nok mutant retinas treated with DAPT or DMSO. The higher level of EdU incorporation in the nok mutant retina is decreased by DAPT treatment. Statistical analyses were carried out by Student’s t-test (K and P, g and h). |

smu mutation enhances defects of retinal neurogenesis in ncad and nok mutants. (A–D) BrdU incorporation in wild-type retina (A) and smu (B), ncad (C) and ncad; smu mutant retinas (D) at 48 hpf. (E–H) Labeling of wild-type (E), smu (F), ncad (G) and ncad; smu mutant retinas (H) with anti-pH3 antibody at 48 hpf. In the ncad; smu double mutant, the boundary between the neural retina and brain was often unclear. Thus, ath5:GFP expression (green) was visualized for demarcating the boundary between the neural retina and the brain (H). Adjacent retinal sections of the same ncad; smu double mutant embryo were used for the analyses of BrdU incorporation (D) and anti-pH3 antibody labeling (H). (I) Ratio of number of BrdU-positive cells to total number of retinal cells in wild-type retina and smu, ncad, and ncad; smu mutant retinas. There is no statistically significant difference in BrdU incorporation level between ncad and ncad; smu mutant retinas (p > 0.05; Student’s t-test). (J) Number of pH3-positive cells per sectioned retina of wild type and smu, ncad, and ncad; smu mutants. The number is higher in the ncad; smu double mutant retina than in the ncad single mutant retina (*p < 0.05: Student’s t-test). (K–N) BrdU incorporation in wild-type retina (K) and smu (L), nok (M), and nok; smu mutant retinas (N) at 48 hpf. (O–R) Labeling of wild-type retina (O) and smu (P), nok (Q), and nok; smu mutant retinas (R) with anti-pH3 antibody at 48 hpf. (S) Ratio of number of BrdU-positive cells to total number of retinal cells in wild-type retina and smu, nok, and nok; smu mutant retinas. There is no statistically significant difference in BrdU incorporation level between nok and nok; smu mutant retinas (p > 0.05; Student’s t-test). (T) Number of pH3-positive cells per sectioned retina of wild type and smu, nok, and nok; smu mutants. The number is higher in nok; smu double mutant retinas than in nok single mutant retinas (*p < 0.05: Student’s t-test). |
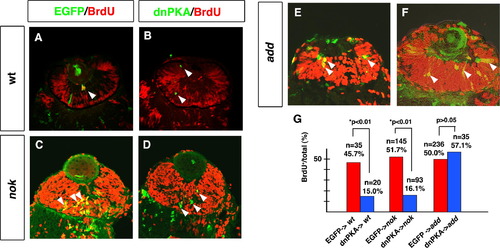
dnPKA inhibits retinal cell proliferation in the nok mutant retina but not in the add mutant retina. (A and B) BrdU-labeled wild-type retinas expressing EGFP (A) and dnPKA (B). (C and D) BrdU-labeled nok mutant retinas expressing EGFP (C) and dnPKA (D). In both the wild type and nok mutant, retinal cells expressing dnPKA (green) do not incorporate BrdU (red) (B and D, arrowheads), whereas retinal cells expressing EGFP are BrdU-positive (yellow) (A and C, arrowheads). (E and F) BrdU-labeled add mutant retinas expressing EGFP (E) and dnPKA (F). Retinal cells expressing dnPKA (green) still incorporate BrdU (yellow) (F, arrowheads), similarly to retinal cells expressing EGFP (yellow) (E, arrowheads). (G) Percentage of BrdU-positive cells with respect to total number of retinal cells expressing dnPKA-GFP (blue bars) or EGFP (red bars) in wild-type retina and nok and add mutant embryos. The percentage of cells showing BrdU incorporation is significantly lower in retinal cells expressing dnPKA than in retinal cells expressing EGFP in wild-type retina and nok mutant retina (*p < 0.01: χ2-test). By contrast, the level of BrdU incorporation in add mutant retinal cells expressing dnPKA is similar to that in add mutant retinal cells expressing EGFP (p > 0.05: χ2-test). |

Unillustrated author statements PHENOTYPE:
|
Reprinted from Mechanisms of Development, 127(5-6), Yamaguchi, M., Imai, F., Tonou-Fujimori, N., and Masai, I., Mutations in N-cadherin and a Stardust homolog, Nagie oko, affect cell-cycle exit in zebrafish retina, 247-264, Copyright (2010) with permission from Elsevier. Full text @ Mech. Dev.