
Fig. 2
- ID
- ZDB-FIG-100520-29
- Publication
- Yamaguchi et al., 2010 - Mutations in N-cadherin and a Stardust homolog, Nagie oko, affect cell-cycle exit in zebrafish retina
- Other Figures
- All Figure Page
- Back to All Figure Page
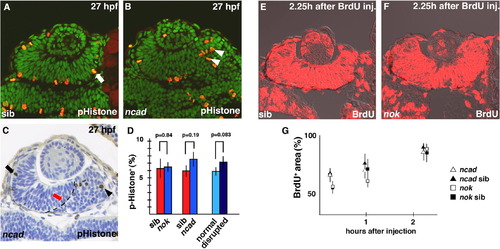
Cell-cycle progression is not altered in ncad and nok mutant retinas at the early stage of retinal neurogenesis. (A and B) Labeling of 27 hpf wild-type retina (A) and ncad mutant retina (B) with anti-pH3 antibody. Dorsal is to the left. In the wild-type retina, pH3-positive cells (red) are located in the ventricular zone (A, arrow), whereas pH3-positive cells fail to associate with the ventricular zone but are abnormally positioned in the ncad mutant retina (B, arrowheads). All the nuclei are stained with Sytox green. (C) Plastic section of 27 hpf ncad mutant retina labeled with anti-pH3 antibody (brown). Dorsal is to the left. All the nuclei are counterstained with toluidine blue. pH3-positive cells are localized at the apical surface of the neural retina in the dorsal cell-polarity normal area (arrow), but detached from the apical surface in the ventral cell-polarity compromised area (arrowhead). The boundary between the cell-polarity-normal region and the cell-polarity-compromised region is very distinct (dashed line) and considered to correspond to a part of AJs detached from the pigmented epithelium (see Fig. 4 in Masai et al., 2003). It is noted that pH3-positive cells are sometimes positioned along the interface in the cell-polarity-normal region (red arrow). These cells are counted as normal polarized cells. (D) Percentage of number of pH3-positive cells with respect to total number of cells in wild-type retina (red bars) and nok and ncad mutant retinas (blue bars), and in cell-polarity-normal region (light blue bar) and cell-polarity-compromised region (dark blue bar) within ncad mutant retina. Statistical analyses were carried out by Student’s t-test. (E and F) BrdU labeling of wild-type retina (E) and nok mutant retina (F) that incorporated BrdU within 2 h 15 min. Approximately 85% of the retinal cells were labeled in wild type and nok mutant retinas. (G) Temporal profile of percentage of BrdU-positive area with respect to total retinal area in ncad (open triangles) and nok mutant (open squares) retinas and their wild-type sibling retinas (filled triangles and squares). The profiles of wild-type retinas and these mutant retinas are similar (Student’s t-test; p > 0.05). |
| Fish: | |
|---|---|
| Observed In: | |
| Stage: | Prim-5 |
Reprinted from Mechanisms of Development, 127(5-6), Yamaguchi, M., Imai, F., Tonou-Fujimori, N., and Masai, I., Mutations in N-cadherin and a Stardust homolog, Nagie oko, affect cell-cycle exit in zebrafish retina, 247-264, Copyright (2010) with permission from Elsevier. Full text @ Mech. Dev.