
- Title
-
Two populations of endochondral osteoblasts with differential sensitivity to Hedgehog signalling
- Authors
- Hammond, C.L., and Schulte-Merker, S.
- Source
- Full text @ Development
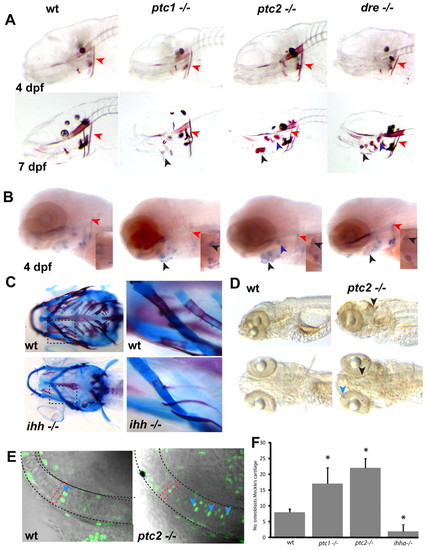
Levels of Hh signalling are critical for endochondral ossification and proliferation of chondrocytes. (A) Alizarin Red staining of representative Hh mutants reveals no differences at 4 dpf. At 7 dpf, however, premature mineralisation of endochondral bone elements can be seen (black arrowheads mark the ceratohyal, purple arrowheads mark the hyosymplectic), while the extent of ossification in the cleithrum is unchanged (red arrowheads). (B) In situ analysis of mutants at 4 dpf reveals increased expression of osterix in the endochondral bone, where premature mineralisation is later seen (black arrowheads point to ceratohyal, purple to hyosymplectic), while osterix expression is unchanged or slightly reduced in dermal bone elements such as the cleithrum (red arrowheads). Insets show ventral views of osterix expression in the ceratohyal. (C) Alcian Blue/Alazarin Red double staining of 17 dpf ihha and wild-type sibling fish. The second panel is an enlargement of the boxed area for each genotype. (D) Whole-mount antibody staining for BrdU incorporation between 4.5 and 5 dpf in wild type and ptc2 mutants. Excessive proliferation can be seen in the ptc2 mutant in the tectum (black arrowhead) and jaw cartilages (blue arrowhead). (E) Representative single confocal images of the Meckel′s cartilage in 5 dpf zebrafish. Proliferating chondrocytes (blue arrowheads) are labelled with anti-BrdU (green), the dashed red line shows the shape of a single chondrocyte. (F) Quantitation of BrdU-positive cells in the Meckel′s cartilage at 5 dpf. Data are mean±s.d. taken of at least five fish per genotype. *P<0.01 versus wild type. wt, wild type. EXPRESSION / LABELING:
PHENOTYPE:
|
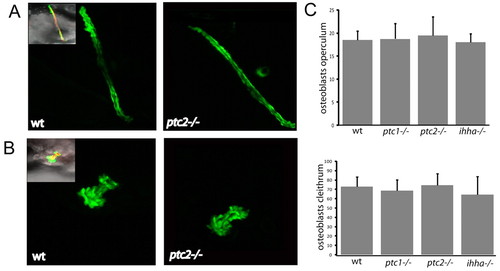
Mutants with altered Hh signalling show no differences in the number of osterix-positive cells in dermal bone elements. (A) Confocal stacks of the cleithra of osterix-nuclear GFP fish at 4 dpf. Inset image on left is a merged image of Tg(osx:nuGFP) (green), Alazarin Red and brightfield images. (B) Confocal stacks of the operculum of osterix-nuclear GFP fish at 4 dpf. Inset image on left is a merged image of Tg(osx:nuGFP) (green), Alazarin Red and brightfield images. (C) Quantification of the number of osterix-positive nuclei in the cleithrum (below) and operculum (above) at 3 and 4 dpf. Data is shown as mean±s.d. taken of at least four fish per genotype. *P<0.05 versus wild type. wt, wild type. EXPRESSION / LABELING:
PHENOTYPE:
|
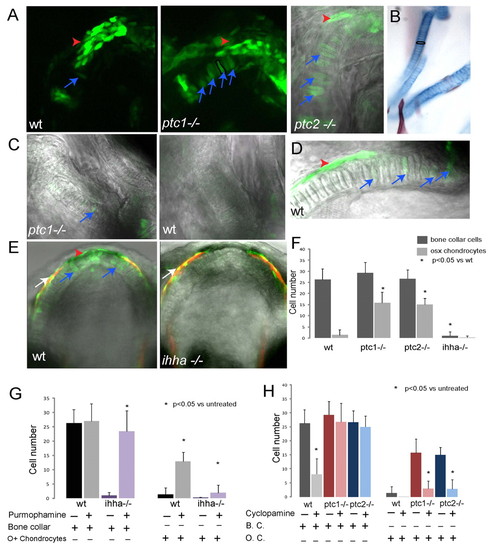
There are two populations of endochondral osteoblasts with differential sensitivity to Hh signalling. (A) Confocal stacks from wild-type, ptc1-/- and ptc2-/- 6 dpf larvae in an osterix-nuclear GFP background, imaged for GFP expression. The far right image is a single confocal plane to allow distinstintion of the cell morphology. At this stage in both ptc mutants and wild-type larvae, similar numbers of bone collar osteoblasts are present (red arrowheads). However, in ptc1-/- and ptc2-/- larvae, there is a significant increase in the number of chondrocytes that express osterix (blue arrows). A single chondrocyte is outlined in black in the image of the ptc1 mutant. (B) A ventral view of one side of the Meckel′s cartilage and ceratohyal of a 6 dpf wild-type larva stained with Alcian Blue and Alizarin Red; a single chondrocyte is outlined in black to demonstrate the morphology of the chondrocyte cells. (C) Confocal stacks of the ceratohyal from ptc1-/- and wild-type embryos at 3 dpf. In ptc1-/- embryos (but not in wild-type siblings) cells can be found that retain the shape of chondrocytes but that express osterix (blue arrow). (D) Confocal stack of the Meckel′s cartilage of a 9 dpf wild type. Expression of osterix is visible in cells within the cartilage element (blue arrows) and outside (red arrowhead). (E) Confocal stacks of the Meckel′s cartilage of wild-type and ihha-/- 9 dpf larvae. By this stage the wild-type embryo has osterix- expressing bone collar cells (red arrowhead) and transdifferentiating chondrocytes (blue arrows), while the ihha-/- larvae has neither. White arrowheads mark the maxilla, a dermal bone, which forms adjacent to the Meckel′s cartilage. (F) Quantification of number of osteoblasts at 6 dpf showing number of osteoblasts in the bone collar of the Meckle′s cartilage and the number of chondrocytes differentiating as osteoblasts in the Meckel′s cartilage. Data are presented as means±s.d. taken from at least six fish per genotype; asterisk represents P<0.05 in paired Student′s t-tests of mutant versus wild type. (G) Quantification of osteoblast number at 6 dpf in the Meckel′s cartilage of embryos treated with 20 μm purmorphamine or controls. Data are presented as means±s.d. taken from at least four fish per genotype; * represents P<0.05 in paired Student′s t-tests of treated versus untreated. (H) Quantification of osteoblast number at 6 dpf in the Meckel′s cartilage of embryos treated with 75 μM cyclopamine or controls. Data are presented as means±s.d. taken from at least four fish per genotype; * represents P<0.05 in paired Student′s t-tests of treated versus untreated. wt, wild type. EXPRESSION / LABELING:
|
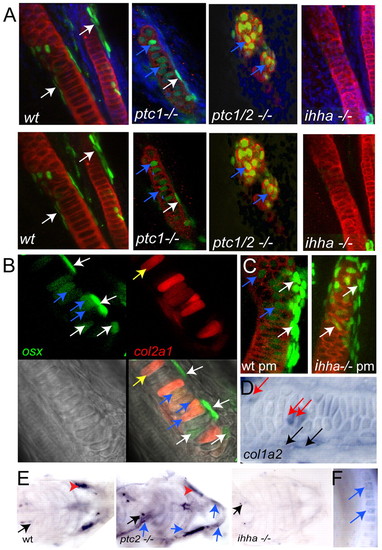
The osterix-expressing cells with chondrocyte morphology express markers of chondrocyte and osteoblast differentiation. (A) Confocal stacks taken of the ceratohyal of 5 dpf embryos stained for collagen II in red, GFP (osterix) in green and DAPI in blue. In wild-type embryos osteoblasts can be seen lying on the surface of the collagen II-positive matrix (white arrows). In ptc1 mutant embryos, similar cells can be seen (white arrows), and also osterix-positive cells, which are completely surrounded by collagen II-positive matrix can be seen (blue arrows). In ptc1/2 double mutants the cartilage structure is disorganised, but all cells surrounded by collagen II-positive matrix are also positive for osterix (blue arrows). In the ihha-/- mutants, neither population of osterix-positive cells are seen, despite the normal appearance of the collagen II-positive cartilage matrix. (B) Confocal stack from a 4 dpf ptc2 mutant osterix-nuGFP larva, injected with a BAC containing mCherry inserted after the ATG of collagen2a1, leading to mosaic expression through the cartilage. White arrows mark cells expressing osterix, which do not contain col2 mCherry. Yellow arrow marks a cell expressing col2 which is negative for osterix, whereas blue arrows mark cells expressing both mCherry and GFP. (C) Confocal stacks from the ceratohyal of collagen 2 (red) and anti-GFP osterix (green) antibody stained 6 dpf larvae treated from 2-6 dpf with purmorphamine. White arrows indicate bone collar osteoblasts overlying the cartilage matrix. Blue arrows mark cells expressing osterix, which are surrounded by cartilage matrix. (D) Col1a2 in situ hybridisation in 9 dpf wild-type embryo, showing the palatoquadrate. Two populations of col1a2 expressing-osteoblasts can be seen. One population is located outside but adjacent to the cartilage matrix (black arrows), whereas the other comprises cells located within the cartilage matrix (red arrows). (E) Ventral views of 5 dpf embryos in situ hybridised for osteocalcin, anterior to right. In all genotypes osteocalcin staining can be seen in the teeth (black arrows). Particularly strong staining in the osteoblasts of the bone collar (red arrowheads) is present in wild-type and ptc2-/-, embryos but is absent for ihha-/-. In ptc2 mutant embryos weaker osteocalcin expression can be seen in cells within the cartilage (blue arrows), which are not seen in wild-type embryos at this stage. (F) High magnification image of Meckel′s cartilage from a ptc2-/- 5 dpf embryo showing osteocalcin expression in cells within the cartilage element (blue arrows). wt, wild type. |
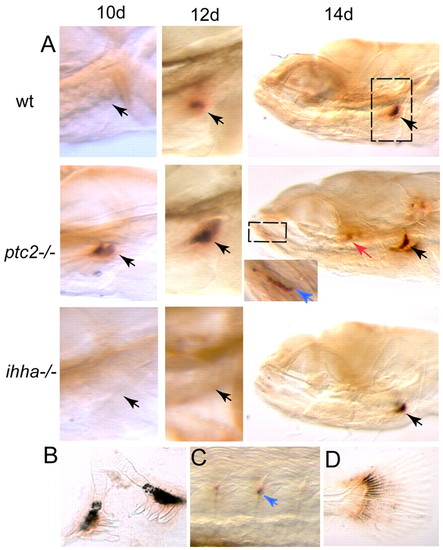
Osteoclasts are active earlier in ptc mutants and later in ihha mutants than in the wild-type situation. (A) Whole mount stained for tartrate resistant acid phosphatases (TRAP). Activity is first present in the fifth branchial arch and in teeth (black arrows). Additionally, by 14 dpf activity can be seen in the Meckel′s cartilage (blue arrow in inset, region enlarged is marked by a dashed box) and operculum (red arrow) in the ptc2-/- mutant. Dashed box in the top right image denotes the region shown for 10 and 12 dpf. (B-D) Close-up views of the regions of TRAP activity: (B) dissected teeth and fifth branchial arch, (C) neural arch, (D) tail fin. wt, wild type. |
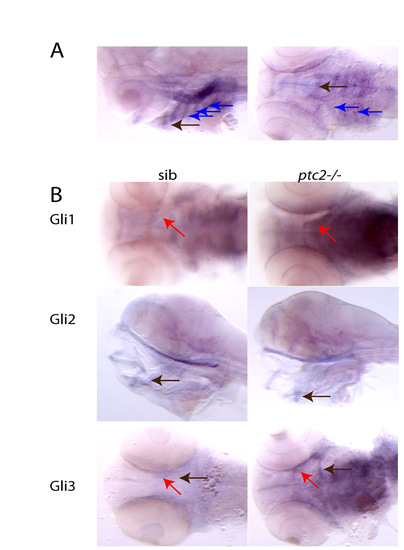
Hedgehog-responsive genes are expressed in ventral jaw cartilages. (A) Ptc2 expression at 4 dpf. Strong expression can be seen in the ceratohyal and Meckel′s cartilage (black arrows), and in the branchial arches in the chondrocyte precursors (blue arrows). (B) Expression of the Hh transcription factors gli1, gli2 and gli3 in sibling and ptc2-/- fish at 4 dpf. Both gli1 and gli3 appear upregulated in the mutants, compared with siblings, particularly in the cartilage precursors of the Meckel′s cartilage (red arrows) and ceratohyal (black arrow in gli3 pictures). By contrast, gli2 expression levels appear to be unchanged or slightly weaker in the mutants than in the siblings. |
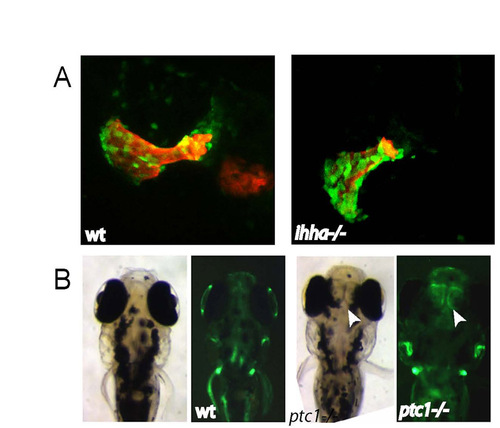
Only small changes to dermal bone formation are observed in Hedgehog signalling mutants. (A) Confocal stacks of wild-type and ihha-/- opercula at 10 dpf, imaged with Tg(osx:nuGFP) (green) and Alazarin Red. (B) Brightfield and fluorescent images of wild-type and ptc1 4 dpf embryos. The arrowhead indicates osterix expression in the ectopic tissue between the eyes of the ptc1 mutant. |
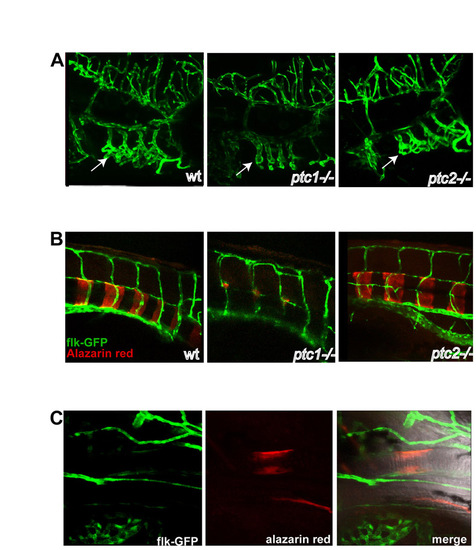
Premature ossification in ptc1 and ptc2 mutants is not accompanied by increased vascularisation. (A) Lateral views of head vasculature at 4 dpf; anterior to the right. In ptc1-/-, the gill vasculature is reduced (white arrows), whereas there is no difference between ptc2-/- and wild-type vasculature. (B) Confocal stack, taken in a wild-type embryo at 7 dpf, of the ceratohyal, showing flk-GFP (green), Alazarin Red (red) and merged image. |