
- Title
-
Expression of zebrafish hip: response to Hedgehog signalling, comparison with ptc1 expression, and possible role in otic patterning
- Authors
- Hammond, K.L., and Whitfield, T.T.
- Source
- Full text @ Gene Expr. Patterns
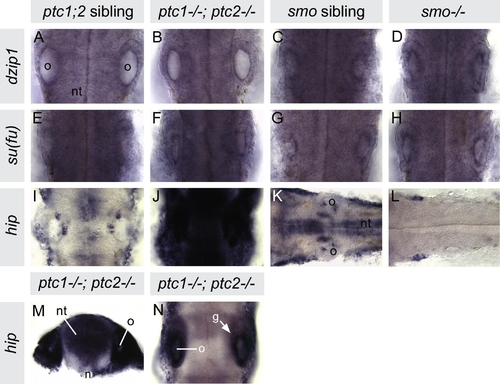
Expression of dzip1, sufu and hip in the otic region of 26hpf wild-type, ptc1-/-; ptc2-/- double mutants and smo-/- single mutants. (A–H) Levels of dzip1 and sufu are unaltered in ptc1-/-; ptc2-/- and smo-/- embryos, in which Hh signalling is severely up- and down-regulated, respectively. (I–L) hip expression is strongly up-regulated in ptc1-/-; ptc2-/- embryos and down-regulated in smo-/- embryos. For comparison, each set of mutants and siblings (A–L) were stained in the same well and photographed using the same light intensity. (M and N) Hand cut transverse section (M) and lightly stained whole-mount (N) ptc1-/-; ptc2-/- specimens showing that, although highly up-regulated, hip expression remains regionalised in the ptc1-/-; ptc2-/- embryo. All panels, except M, are dorsal views of the hindbrain and otic region of whole-mount 26hpf embryos. Anterior is to the top except in panels K and L, where anterior is to the left, and panel M, which is a transverse hand cut section at the level of the otic vesicle, dorsal to top. Abbreviations: g, statoacoustic ganglion; n, notochord; nt, neural tube; o, otic vesicle. EXPRESSION / LABELING:
|
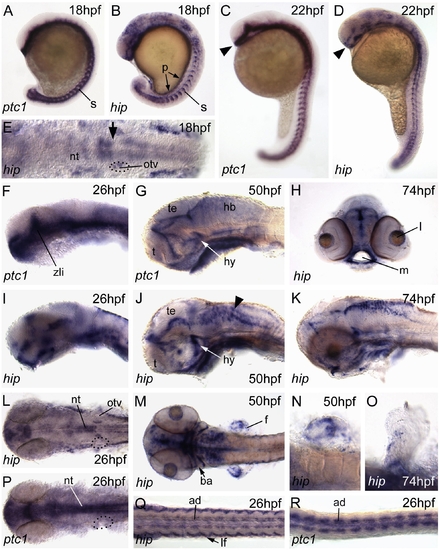
Comparison of the embryonic expression patterns of hip and ptc1. Images of whole-mount preparations hybridised with riboprobe to hip or ptc1. hip and ptc1 expression domains have similarities, e.g., in the adaxial region (ad) of the somites (s) (A–D and Q, R), but are not identical. In particular, note the differences in forebrain expression between C and D (arrowheads) and F and I, and the hindbrain (hb) expression present in J (hip; arrowhead) but not in G (ptc1). In addition, in the neural tube, hip is expressed in only a subset of the ptc1 domain: compare L (hip) and P (ptc1). Note that in the head, the posterior domain of a region of strong neural tube expression lies adjacent to the anterior part of the otic vesicles from 18hpf (18S) to 26hpf (E, L; arrow in panel E): dotted lines demarcate the left otic vesicle in panels E, L, P. Other regions of hip expression include the fin buds, branchial arches, pronephros and mouth region. (A–D) Lateral views; anterior to top. (F, G, I–K) Lateral views; anterior to left, dorsal to top. (H) Hand cut transverse section at anterior limit of embryo showing mouth region. All other panels: dorsal views, anterior to left. Abbreviations: ad, adaxial cells; ba, branchial arches; f, fin buds; hb, hindbrain; hy, hypothalamus; lf, lateral fibres; l, lens; m, mouth; nt, neural tube; otv, otic vesicle; p, pronephros; s, somites; t, telencephalon; te, tectum; zli, zona limitans intrathalamica. Panels J and Q are composites of more than one image. EXPRESSION / LABELING:
|
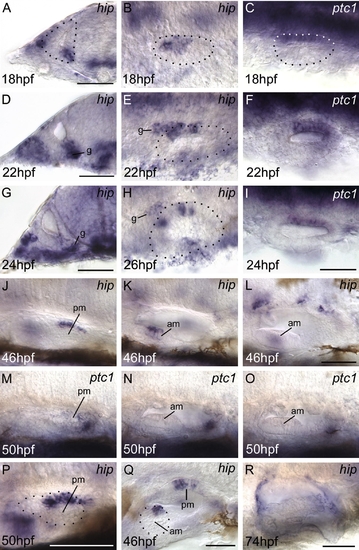
Expression of hip in the developing inner ear. (A–C) At 18hpf (18S) strong hip expression is detected in an anterior domain of the ventromedial (VM) region of the otic vesicle. ptc1 is also detected in an anterior VM domain. (D–F) At 22hpf (26S) hip is expressed in the statoacoustic ganglion (SAG) as well as in the anterior domain of the VM otic region. ptc1 is now detected in the posterior of the VM otic epithelium but is not expressed in the SAG. (G–I) By 26hpf hip expression in the VM otic epithelium splits into two distinct domains, one anterior and one medial. Low levels of expression remain in the SAG. ptc1 expression remains at the posterior of the vesicle. (J–L, P, Q) By 46–50hpf hip expression is detectable in a dorsal domain of the posterior macula (J, P, Q) and in a small medial region of hair cells in the anterior macula (K, L, Q). ptc1 is detectable more weakly in a posterior region that includes posterior otic epithelium and part of the posterior macula, but is not expressed in the anterior macula (M–O). At 74hpf (not shown) ptc1 expression is similar but extremely weak. (R) By 74hpf, hip expression is only present in cells around the edges of the ear. (A, D, G) Hand cut transverse sections through the otic vesicle, dorsal to top, midline to right. (B, C, E, F, H, I, Q) Dorsal views, anterior to left, midline to top. (J–P, R) Lateral views, anterior to left, dorsal to top. The dotted regions in A–C, E and H demarcate the outline of the otic vesicle. Panels (J–L) and (M–O) each show three focal planes (left to right = medial to lateral) of the same ear. Panel P is a higher power view of the posterior macula region of a separate ear to that shown in J. Dotted lines in P and Q demarcate the posterior and anterior maculae, respectively. Abbreviations: am, anterior (utricular) macula; g, statoacoustic ganglion; pm, posterior (saccular) macula. Scale bars, 50 μm. Scale bar for B, C, E, F, H, I shown in I; for J–O shown in L. EXPRESSION / LABELING:
|
Reprinted from Gene expression patterns : GEP, 9(6), Hammond, K.L., and Whitfield, T.T., Expression of zebrafish hip: response to Hedgehog signalling, comparison with ptc1 expression, and possible role in otic patterning, 391-396, Copyright (2009) with permission from Elsevier. Full text @ Gene Expr. Patterns