
- Title
-
Repeated, noninvasive, high resolution spectral domain optical coherence tomography imaging of zebrafish embryos
- Authors
- Kagemann, L., Ishikawa, H., Zou, J., Charukamnoetkanok, P., Wollstein, G., Townsend, K.A., Gabriele, M.L., Bahary, N., Wei, X., Fujimoto, J.G., and Schuman, J.S.
- Source

The appearance of the 72 hpf zebrafish with millimeter ruler, at magnification, and as observed by SD-OCT provided for appreciation of its small size. Zebrafish embryos were embedded in 1% agarose gel in an inverted microscopy Petri dish (A, B; B shows a magnified region of A). Embryos were scanned in three dimensions (3D), and reflectance of internal structures quantified. C-mode sections of the 3D data set could be isolated and tissue reflectance within a slice is displayed (C). |
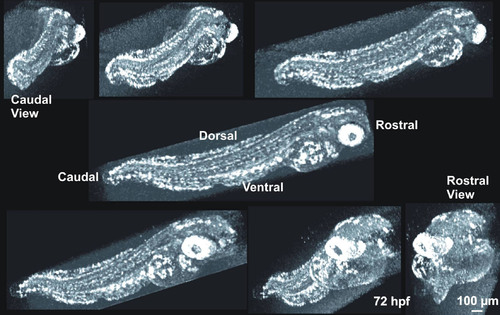
Rotation of a 3D image dataset of a 120 hpf embryo. SD-OCT can acquire a 3 dimensional quantitative description of the tissues within zebrafish embryos. These data allow the non-invasive visualization of the entire animal, as well as cross-sectional slices in any orientation through the animal at any stage of development, all without sacrificing the animal or noticeably impeding development. This gross anatomical visualization of the zebrafish was rendered in 3D-View, using the maximum intensity projection display. |
Data averaging reduces noise and enhances contrast between structures. A: A rolling 3-frame average within a 120 h post fertilization (hpf) embryo improves visualization of soft tissue structures in the gut while blurring the sharp features of the eye and ear. B: A side by side comparison of a single frame and a 120 frame averaged within the brain of a 24 hpf embryo demonstrates that aggressive averaging of repeated line scans increased visualization of soft tissue features and reduced noise. |
Images were resampled to correct the irregular data density of the raw scans. The Z axis (vertical axis of the image) is fixed at 1,024 reflectance measurements along a 2 mm line. A X,Y scanning pattern was optimized for the body of the animal, with a X,Y a-scan density of 501x180, yielding the uncorrected aspect ratio observed in the left frame. Scan data were resampled, utilizing spline interpolation, to produce images with a 1:1 aspect ratio for structural measurements and visualization. |
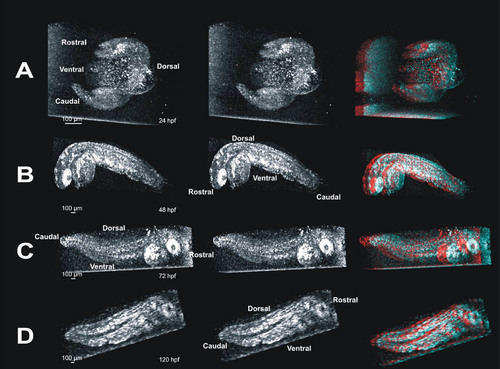
Stereo pairs of images reveal internal structures in whole embryos in three dimensions. These panels provide visualization of three dimensional (3D) data in a printed image. Such data are best visualized interactively, rotating the projected data manually to obtain an optimal view of the structure of interest; impossible in printed image (see also Figure 2). Panel A contains a 3D crossed-stereo image of a 24 hpf embryo. To view, gently cross your eyes until 3 images appear, and focus on the image in the middle. The image on the far right of panel A is the same image, and can be viewed with red/blue 3D glasses to visualize the embryo in 3D. Panel B contains a crossed-stereo pair and red/blue stereo image of a 24 hpf embryo. Panel C contains a 72 hpf stereo-pair and red/blue 3D image. In panels A-C, the embryo appears to be facing out of the image. Panel D contains a stereo-pair and red/blue 3D image of a 120 hpf embryo facing into the image. |

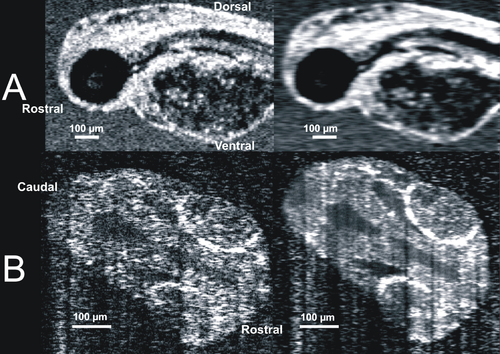
Visualization of developing internal anatomy of zebrafish embryos. Twenty-four hours post fertilization (hpf): A C-mode slice (left, 750 μm) centered on the eye, and a repeated line scan (right, 750 μm) centered on the brain and eye provide visualization of numerous internal structures within the brain, eye, and gut, as well as fluid spaces developing as ventricles within the brain. 48 hpf: C-mode slices at the level of the ear (left, 750 μm) and notochord (right, 1.5 mm). Microscopic structures of the eye, brain, gut, and heart can be visualized throughout. Blood within vessels and the heart create a bright reflection when isolated in a sagittal plane (left) while casting shadows on underlying tissues (right). 72 hpf: An averaged repeated line scan of the eye (left, 750 μm) reveals the cornea, lens, retina, and retinal pigment epithelial and choriocapillaris complex (RPE/CC) layer of the right eye of a zebrafish embryo. The RPE/CC of the left eye is the only structure within the left eye with sufficient reflectance to be observed. The C-mode slice (right, 1.5 mm) centered on the heart provides visualization of both chambers of the heart as well as numerous structures within the gut and brain. 120 hpf: An averaged repeated line scan of the eye (left, 750 μm) shows the cornea, lens, retina, and RPE/CC layer of the right eye. A C-mode slice (right, 4 mm) displays structures of the heart, gut, and brain, documenting the development that has occurred in only 120 hpf. |

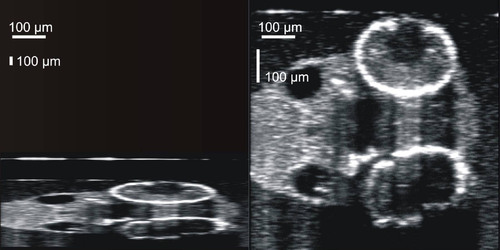
Blood within vessels creates shadow artifacts in C-mode slices below the vessels. Images of the same 48 hpf embryo obtained in a shallow slab location (A) and a deep location (B) allow visualization of blood, which is highly scattering (A, bright locations, arrows), and the resultant shadows mask structure in deeper slabs (B, dark locations, arrows). |
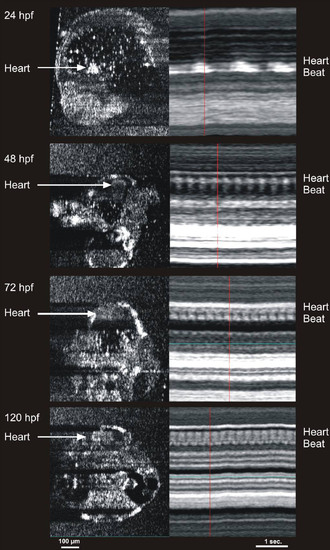
Cardiac M-mode images of the heart in 24, 48, 72, and 120 hours post fertilization embryos. The bright signal was created by blood within the heart. Note the increase in heart rate with development, as well as the development of two chambers at 72 hours post fertilization (hpf). The heart rates observed in the m-mode images are 47 beats per min (bpm) in the 24 hpf embryo, 157 bpm in the 48 hpf embryo, 219 bpm in the 72 hpf embryo, and 250 bpm in the 120 hpf embryo. |
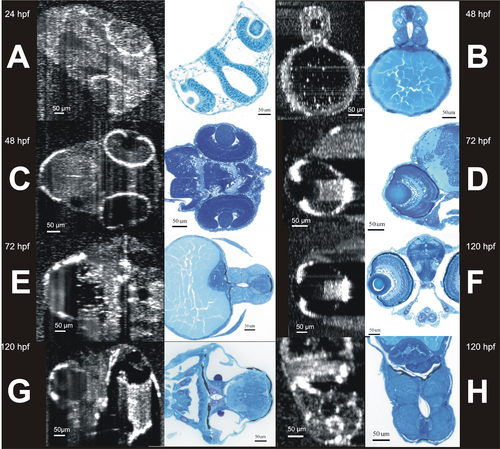
Side to side comparison of head and body structures visualized by SD-OCT and histology. SD-OCT images (left in each pair) were obtained noninvasively from living embryos, leaving them healthy and capable of continued growth. Similar structural data was obtained histologically, requiring sacrifice and sectioning before any information was obtained, and guaranteeing that any interesting structural observations can never be followed longitudinally. A shows the development of the eyes and ventricle of a 24 hours post fertilization (hpf) embryo. B and C show development of the spine and eyes of a 48 hpf embryo respectively. D and E show the development of the eye, spine, and liver at 72 hpf. F, G, and H show the development of the eye, ear, heart, and spine of the 120 hpf embryo. |

Visualization of individual animals imaged on two different days. These images were obtained from the same embryo on two different days: 72 hpf and 120 hpf. C-mode images of the heart (A, circled), eye (B), and ear (C, circled) are presented. The heart is also visible in C, but blurred due to averaging over multiple cardiac cycles. It is possible that the first imaging session altered development. To compare the 120 hpf twice-imaged embryos to 120 hpf embryos imaged only once, refer to Figure 6 and Figure 9. |
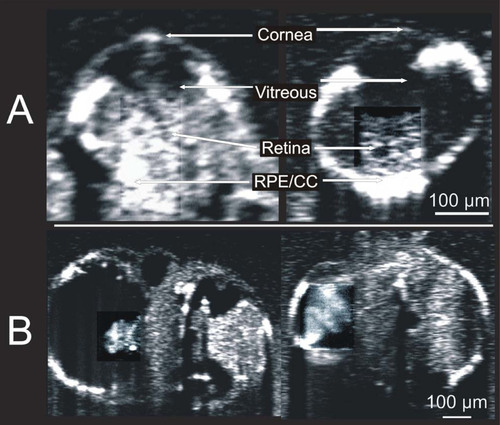
Visualization of mutations associated with nok m520 gene mutation. Side by side comparison of 72 hours post fertilization embryo eye (A) and heart (B) structures, with nok m520 mutant embryo genotypes on the left, and embryos of the same age without the nok m520 gene mutation. Contrast was enhanced in the retina and heart. PHENOTYPE:
|