
- Title
-
Regionalized calcium signaling in zebrafish fertilization
- Authors
- Sharma, D., and Kinsey, W.H.
- Source
- Full text @ Int. J. Dev. Biol.

Calcium release following fertilization of the zebrafish oocyte. Changes in cytosolic free calcium were detected by calcium green-dextran fluorescence imaged by confocal fluorescence. The oocyte was immobilized in a 750 μm well with the animal pole oriented to the upper right. Unfertilized oocytes were injected with calcium green dextran to achieve a final intracellular concentration of 500 nM, and allowed to recover for 10 min before photography began. Calcium release was initially observed within a thin layer of cortical cytoplasm near the animal pole, and subsequently spread laterally to involve the entire oocyte cortex. The cytoplasm of the blastodisc was highly active in calcium signaling during the later stages of oocyte activation and cleavage. Images were taken with a 4X objective just before addition of sperm + aquarium water, time=0 (A) and at different times; 1 min (B), 12 min (C), 35 min (D), 45 min (E) and 55 min (F) after insemination. |

Calcium signaling during early stages of oocyte activation. The progression of calcium release during the first eight minutes post-insemination was monitored by calcium green fluorescence as described in Fig. 1. The initial calcium release occurred in a small region of cortical cytoplasm, but spread peripherally to include the entire cortex by 8mpi. Calcium release in the central cytoplasm also spread from the animal pole (left) to include the entire oocyte. The time post-insemination is indicated at the top of each panel and magnification is indicated by the bar which represents 100 μm. |

Calcium signaling at the site of sperm incorporation. The progression of calcium release at the micropyle was followed by using a suction pipette to position an oocyte such that the micropyle was visible. Calcium green dextran was then injected from the left and after a 10-min recovery period, images from transmitted light (upper panels) and calcium green fluorescence (lower panels) were recorded at 15 sec intervals. Unfertilized oocyte (A), 0.5 mpi (B), 1.0 mpi (C), 1.5 mpi (D) and 2.0 mpi (E). The position of the depression in the oocyte cortex caused by the micropyle is indicated by the white arrow. The fertilization cone is indicated by the black arrow. The clear cytoplasm at the animal pole which became apparent at 2.0 mpi is indicated by (*).The initial calcium release at the site of sperm fusion is barely recognizable in (B), but obvious in (C). It is also apparent that the initial calcium response at the site of sperm-egg interaction is strongly amplified once it reached the animal pole. Magnification is indicated by the bar, which represents 25 μm. |
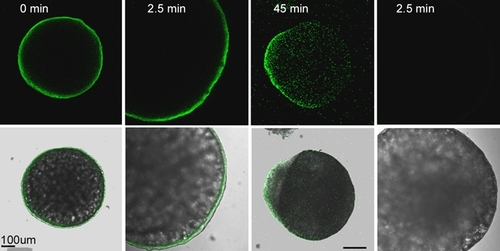
Localization of IP3r in the zebrafish oocyte. Oocytes were fixed before (A) or at different times after fertilization; 2.5 mpi (B,D), 45 mpi (C). The fixed oocytes were then processed for immunofluorescence as described in ‘Materials and Methods’. Oocytes were labeled with the anti-IP3r type 1 antibody (A,B,C) at a concentration of 0.5 μg/ml or with normal rabbit IgG (D) as a control. Bound antibody was detected with goat anti-rabbit IgG conjugated with Alexa Fluor-488. Immunofluorescence analysis demonstrated that the IP3 receptor was initially distributed uniformly in the oocyte cortex with no concentration at the animal pole, but later became concentrated over the blastodisc evident in (C) as a bulge of clear cytoplasm. |

Localization of Fyn in the zebrafish oocyte. Oocytes were fixed before (A) or at different times after fertilization: 2.5 mpi (B,D), 45 mpi (C). The fixed oocytes were then processed for immunofluorescence. Oocytes were labeled with the anti-Fyn3 antibody (A,B,C) at a concentration of 0.5 μg/ml or with Fyn3 antibody + the synthetic peptide antigen (1 mM) as a control (D). Bound antibody was detected with goat anti-rabbit IgG conjugated with Alexa Fluor-488. Prior to and immediately after fertilization, the distribution of Fyn kinase differs from that of the IP3 receptor in that it is concentrated at the animal pole even before fertilization (A) and at the site of sperm fusion (white arrow, B). By 45 mpi (C), Fyn was localized over the blastodisc cortex and was usually concentrated within a smaller region of the blastodisc possibly indicating a region of intense signaling. |

Localization of activated Src-family PTKs in the zebrafish oocyte. Zebrafish oocytes were fixed at 1.5 mpi to capture the fertilization cone with attached sperm. They were then processed for immunofluorescence in the presence of phosphatase inhibitors and then incubated with the clone-28 antibody to label activated (dephosphorylated) Src-family PTKs (0.5 μg/ml). Bound antibody was detected with goat anti-mouse IgG conjugated to Alexa fluor-488. The fertilizing sperm is visible as a round spot at the apex of the fertilization cone which protrudes from the right hand edge of the oocyte. Src-family PTKs were strongly activated in the region of the fertilization cone indicating the response of the oocyte to fertilization. Magnification is indicated by the bar which represents 25μm. |