
Fig. 8
- ID
- ZDB-FIG-080730-11
- Publication
- Sharma et al., 2008 - Regionalized calcium signaling in zebrafish fertilization
- Other Figures
- All Figure Page
- Back to All Figure Page
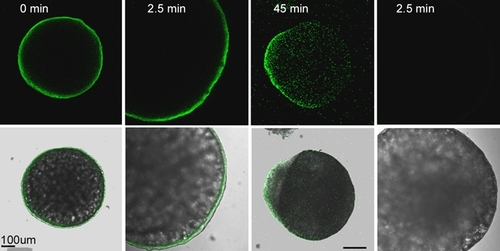
Localization of IP3r in the zebrafish oocyte. Oocytes were fixed before (A) or at different times after fertilization; 2.5 mpi (B,D), 45 mpi (C). The fixed oocytes were then processed for immunofluorescence as described in ‘Materials and Methods’. Oocytes were labeled with the anti-IP3r type 1 antibody (A,B,C) at a concentration of 0.5 μg/ml or with normal rabbit IgG (D) as a control. Bound antibody was detected with goat anti-rabbit IgG conjugated with Alexa Fluor-488. Immunofluorescence analysis demonstrated that the IP3 receptor was initially distributed uniformly in the oocyte cortex with no concentration at the animal pole, but later became concentrated over the blastodisc evident in (C) as a bulge of clear cytoplasm. |