
- Title
-
Anthrax lethal toxin induces cell death-independent permeability in zebrafish vasculature
- Authors
- Bolcome, R.E. 3rd, Sullivan, S.E., Zeller, R., Barker, A.P., Collier, R.J., and Chan, J.
- Source
- Full text @ Proc. Natl. Acad. Sci. USA
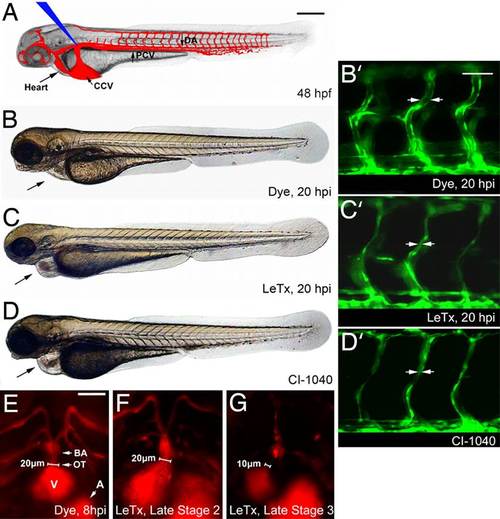
LeTx effects in zebrafish embryos. (A) Diagram of zebrafish embryo at 48 hpf (time point of toxin protein microinjection, at blue arrow), functional vasculature in red. (B–D) Images were taken at 68 hpf. (B) An inert phenol red dye was injected as vehicle in all control embryos and a WT phenotype was observed at 68 hpf, or 20 hpi. (C) 1× LeTx (defined below) generated pericardial edema and narrowed vessels (C′). (D) Embryo was treated with 2.5 µM CI-1040 at 48 hpf for 6 h, then washed out. Black arrow indicates heart and pericardial edema in A–D. (Scale bar, 250 µm.) (B2–D2) Enlarged images showing LeTx and CI-1040 induced narrowing of ISVs in Tg(fli1:EGFP)y (19) embryos, indicated by arrows. (Scale bar, 80 µm.) (E–G) LeTx-injected Tg(gata1:dsRED) (21) embryos exhibited outflow tract lumen size reduction from 20 µm to <10 µm between LeTx phenotype stages 2 (F) and 3 (G). (Scale bar, 50 µm.) DA, dorsal aorta; PCV, posterior cardinal vein; CCV, common cardinal vein; ISV, intersegmental vessel; BA, bulbous arteriosus; OT, outflow tract; A, atrium; V, ventricle, for all figures. 1× LeTx is defined as 37 fmol of LF and 25 fmol of PA. |
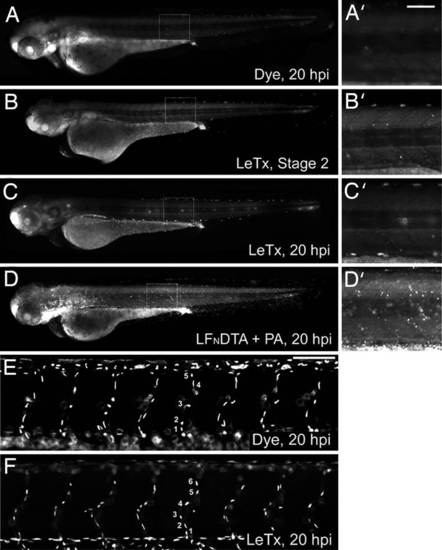
LeTx does not induce generalized cell death or alter endothelial cell numbers in intact zebrafish embryonic vasculature. (A–D) Embryos were stained with acridine orange to examine cell death in dye-injected (A), LeTx-injected embryo at stage 2 or end stage of 20 hpi (B and C), or LFNDTA plus PA-injected (D) embryos. No significant difference was observed between dye and LeTx-injected embryos (A–C), whereas overall cell death was observed in those injected with LFNDTA plus PA (D) (each panel representative of n > 20 embryos). (A′–D′) Enlarged views of boxed regions. (E and F) Nuclei counts using the TG(fli1:nEGFP)y7 (20) line demonstrated equal endothelial cell numbers over the eight ISVs anterior to the cloacae between dye-injected controls (E), and embryos displaying a severe LeTx phenotype (F). There was no difference in the numbers of nuclei in this region between severe or mild phenotype and WT embryos (N = 3, n = 6 per condition; P = 0.378 and 0.887 respectively). Statistics were completed by using the Holm-Sidak method. (Scale bars, 80 µm.) |
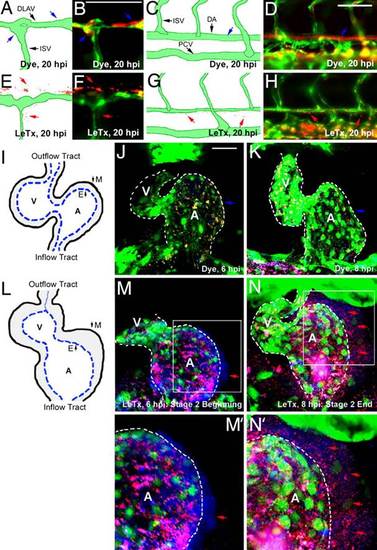
Microsphere leakage in the zebrafish blood vessels and heart. The Tg(fli1:EGFP)y1 line was used for EGFP-labeled endothelial cells; fluorescent microspheres (100 nm, blue; 500 nm, red) were injected at the beginning of stage 2 and leakage was monitored at 20 hpi. (A–D) Panels indicate WT distribution of microspheres within blood vessels (blue arrows). (E–H) Panels indicate LeTx induced microsphere leakage (red arrows). (I–N) The heart was chosen for ease of photography as microspheres are trapped between the endocardial and myocardial layers. (I) A schematic of a control embryonic heart. (J and K) Control embryos injected with dye injection did not show microsphere leakage. (L) A schematic drawing indicates a thickened heart wall because of vascular leakage. (M and N) Embryos previously injected with 2× LeTx (75 fmol of LF and 50 fmol of PA) displayed leakage of 100-nm blue microspheres at the beginning of stage 2 (red arrows, M), and 500-nm red microspheres at the end of this stage (red arrows, N). A dotted line indicates the endocardial layer (M′ and N′). E, endocardium; M, myocardium; DLAV, dorsal longitudinal anastomotic vessel. (Scale bar, 50 µm.) |