
|
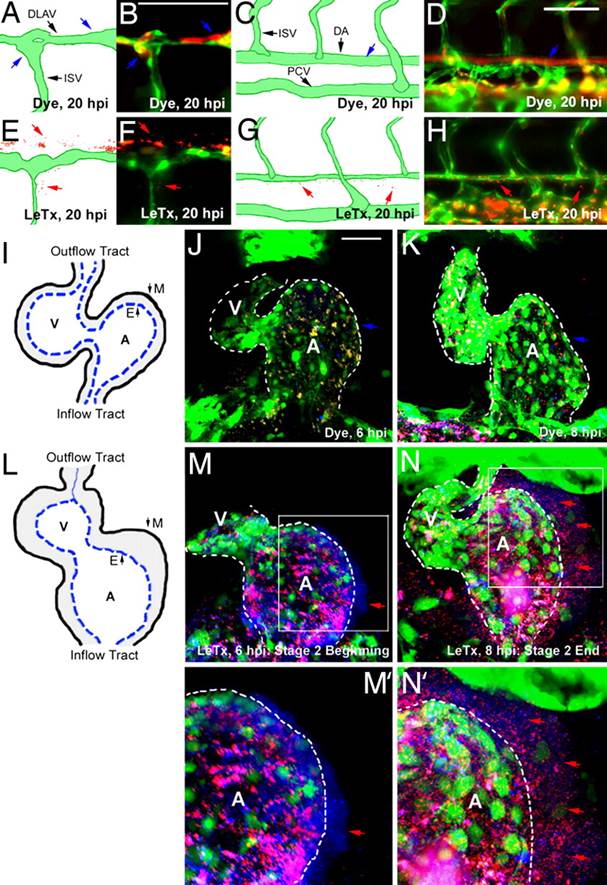
Fig. 4
Microsphere leakage in the zebrafish blood vessels and heart. The Tg(fli1:EGFP)y1 line was used for EGFP-labeled endothelial cells; fluorescent microspheres (100 nm, blue; 500 nm, red) were injected at the beginning of stage 2 and leakage was monitored at 20 hpi. (A–D) Panels indicate WT distribution of microspheres within blood vessels (blue arrows). (E–H) Panels indicate LeTx induced microsphere leakage (red arrows). (I–N) The heart was chosen for ease of photography as microspheres are trapped between the endocardial and myocardial layers. (I) A schematic of a control embryonic heart. (J and K) Control embryos injected with dye injection did not show microsphere leakage. (L) A schematic drawing indicates a thickened heart wall because of vascular leakage. (M and N) Embryos previously injected with 2× LeTx (75 fmol of LF and 50 fmol of PA) displayed leakage of 100-nm blue microspheres at the beginning of stage 2 (red arrows, M), and 500-nm red microspheres at the end of this stage (red arrows, N). A dotted line indicates the endocardial layer (M′ and N′). E, endocardium; M, myocardium; DLAV, dorsal longitudinal anastomotic vessel. (Scale bar, 50 µm.)