
- Title
-
Robo-Slit interactions regulate longitudinal axon pathfinding in the embryonic vertebrate brain
- Authors
- Devine, C.A., and Key, B.
- Source
- Full text @ Dev. Biol.
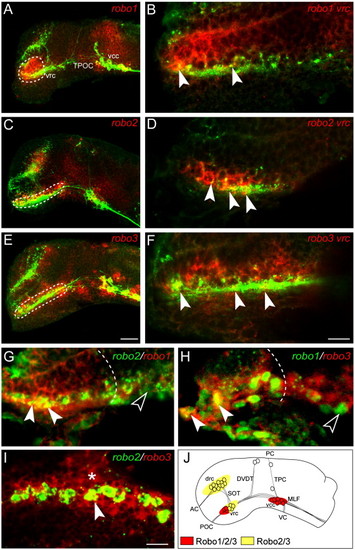
Robo family members are expressed in the brain during the formation of the axon scaffold. Lateral views of whole mount zebrafish brains double labeled for the expression of robo family members (red) and the HNK-1 epitope (green) at 22 h post-fertilization (hpf). Rostral is to the left and dorsal is to the top. (A) At 22 hpf, robo1 expression is observed in the ventral diencephalon (dashed outline), ventrocaudal cluster (vcc) and midbrain. (C) robo2 expression was observed in the ventrorostral cluster (vrc; dashed outline), dorsorostral cluster (drc) and vcc. (E) robo3 expression was detected in the vrc (dashed outline), drc and vcc. Single slice confocal analysis of robo expression reveals co-localization of individual robo receptors to vrc cell bodies at 22 hpf (B, D and F, filled arrowheads). (G–I) Double in situ hybridization for robo family members in the rostral diencephalon at 22 hpf, rostral is to the left, dorsal is to the top. robo1 co-localizes with robo2 (G, filled arrowheads) and robo3 (H, filled arrowhead) in a subset of rostrally positioned cells (dashed outline defines the caudal limit of co-expression). Outside of this region of overlap, additional cells were identified that expressed only one of the robo receptors (G and H, unfilled arrowheads). robo3 co-localizes with the majority of robo2-expressing cells (I, filled arrowhead) and is also detected in surrounding cells (I, asterisk). (J) Schematic representation of robo1, -2 and -3 mRNA expression at 22 hpf. Scale bars: A, C, E: 50 μm; B, D, F: 10 μm; G–I: 12.5 μm. EXPRESSION / LABELING:
|
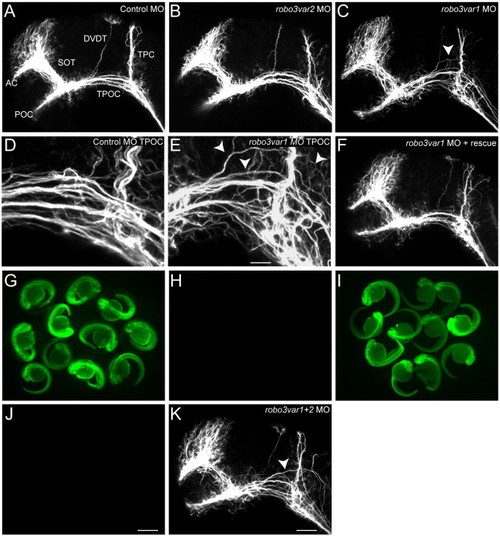
Aberrant dorsal spreading of the TPOC is observed following knockdown of Robo3. Scaffolds of 28 hpf zebrafish embryos labeled with acetylated α-tubulin. Rostral is to the left, dorsal is to the top. (A) In control MO scaffolds (5 ng), the axon tracts develop normally. (B) No significant axon guidance defects were observed following knockdown of robo3var2. Aberrant growth of axons in the TPOC was observed in robo3var1 MO1-injected embryos; TPOC axons were observed to spread out into more dorsal regions of the mesencephalon (C, arrowhead; compare D and E). (F) Coinjection with 350 pg of robo3-rescue cRNA rescued the robo3var1 MO induced TPOC defect. (G–J) Robo3 morpholinos act specifically to knockdown their targeted isoform (var1 or var2). Embryos injected with 250 pg 5′ robo3var1-GFP cRNA (G) or 250 pg 5′ robo3var2-GFP cRNA (I) show strong fluorescence at 28 hpf, which is lost following coinjection with the respective MO (robo3var1 MO1, H or robo3var2 MO1, J). (I) robo3var1 MO1 failed to abrogate GFP expression when coinjected with 52robo3var2-GFP cRNA, confirming that robo3-var1 MO1 specifically targets the var1 isoform. (K) The TPOC spreading phenotype was observed at a similar penetrance when both robo3var1 and robo3var2 were simultaneously knocked down (arrowhead). Scale bars: A–C, F, K: 50 μm; D, E: 17 μm; G–J: 375 μm. PHENOTYPE:
|
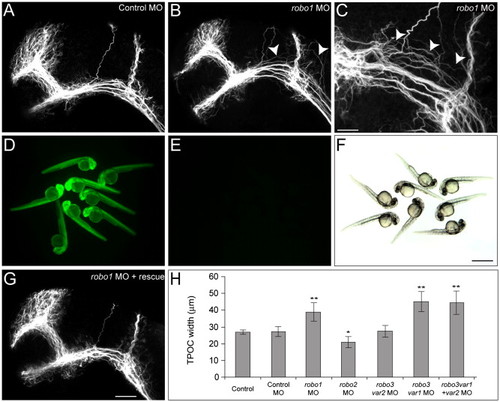
Aberrant dorsal spreading of the TPOC is observed following knockdown of Robo1. Dissected brains of 28 hpf zebrafish embryos labeled with acetylated α-tubulin to show all axons. Rostral is to the left and dorsal is to the top. (A) In control embryos the scaffold of axon tracts develops normally. Following injection of 5 ng robo1 MO2, TPOC axons were observed to spread inappropriately into more dorsal regions of the mesencephalon (B and C; arrowheads). (D–G) The specificity of the robo1 MO knockdown was verified by loss of GFP fluorescence following coinjection of 250 pg 5′ robo1-GFP cRNA and 5 ng robo1 MO2 (E, bright field in panel F) and rescue of the TPOC phenotype by coinjection with 250 pg of robo1-rescue cRNA (G). (H) The severity of the TPOC spreading phenotype was quantified by measuring the width of the TPOC. Values represent the mean ± SD. Average TPOC width measurements were analyzed using ANOVA, followed by the Tukey HSD test, *P < 0.05, **P < 0.001. Scale bars: A, B, G: 50 μm; C: 20 μm; D–F: 400 μm. PHENOTYPE:
|
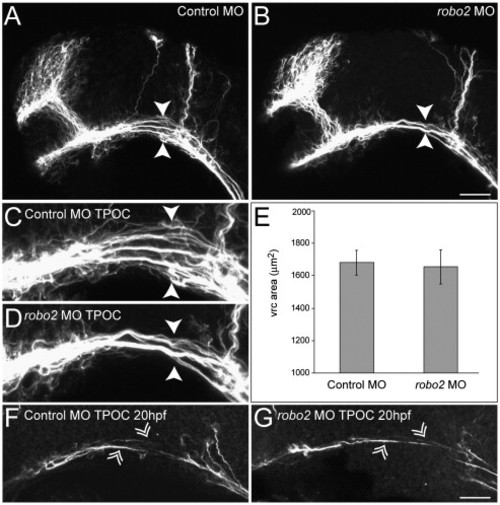
Knockdown of robo2 leads to a partial collapse of the TPOC. Dissected brains are labeled with acetylated α-tubulin at 28 hpf to show all axons. Rostral is to the left and dorsal is to the top. (A) The axon scaffold developed normally in embryos injected with 5 ng of control MO. By contrast, following knockdown of robo2 (5 ng MO2) the TPOC appeared to collapse along its dorsoventral axis (B, arrowheads; compare higher power images in panels C and D). (E) Quantification of the vrc surface area by HuC staining confirmed that the collapsed TPOC phenotype was not associated with a reduction in the size of this neuronal cluster. Values represent the mean ± SD. Significance was assessed using the Student′s t-test. (F) No qualitative differences were observed in the outgrowth of TPOC pioneer axons (double arrowheads) between control MO (5 ng; F) and robo2 MO2 (5 ng, G) scaffolds at 18–20 hpf. Scale bar: A, B: 50 μm; C, D, F, G: 20 μm. PHENOTYPE:
|
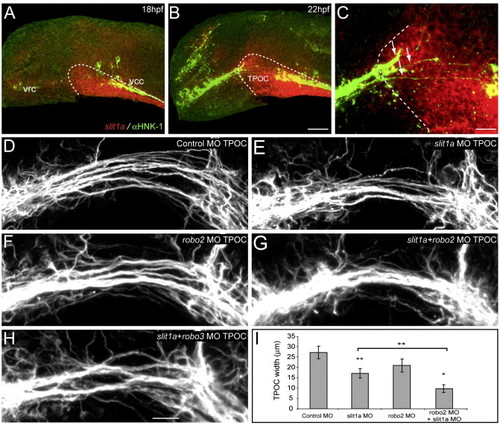
Slit1a is the putative Robo2 ligand in the TPOC. (A–C) The spatiotemporal expression pattern of slit1a suggests a role in the guidance of axons in the TPOC. At 18 hpf, slit1a is first observed at the ventral midline and in a broad domain of neuroepithelium through which the TPOC projects (A, dashed line). This expression is still present at 22 hpf (B). The rostral limit of slit1a expression (C, dashed line) coincides with the point at which the TPOC splits from a single bundle of axons into a number of distinct fascicles (C, arrows). (D–I) Lateral view of the TPOC at 28 hpf labeled with acetylated α-tubulin. Rostral is to the left, dorsal is to the top. (D) The TPOC developed normally following injection of standard control MO (10 ng). By contrast, injection of 2.5 ng of slit1a MO1 led to a significant reduction in the width of the TPOC (E), similar to that observed following knockdown of robo2 (F). (G) The TPOC appears as a single thick bundle of axons following coinjection of slit1a MO1 and robo2 MO2 (1 ng and 2 ng of each MO respectively, 3 ng total). (H) The TPOC phenotype of slit1a + robo3 loss-of-function embryos was similar to that obtained following knockdown of slit1a (E). (I) Average TPOC width measurements were analyzed using ANOVA, followed by the Tukey HSD test. Values represent the mean ± SD. **P < 0.0001, *P < 0.01. Scale bar: A, B: 50 μm; C: 25 μm; D–H: 20 μm. EXPRESSION / LABELING:
PHENOTYPE:
|

Unillustrated author statements PHENOTYPE:
|
Reprinted from Developmental Biology, 313(1), Devine, C.A., and Key, B., Robo-Slit interactions regulate longitudinal axon pathfinding in the embryonic vertebrate brain, 371-383, Copyright (2008) with permission from Elsevier. Full text @ Dev. Biol.