
- Title
-
Monitoring Notch1 activity in development: Evidence for a feedback regulatory loop
- Authors
- Del Monte, G., Grego-Bessa, J., González-Rajal, A., Bolós, V., and De La Pompa, J.L.
- Source
- Full text @ Dev. Dyn.
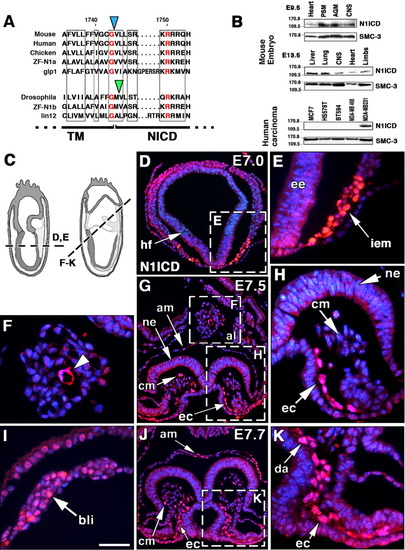
Notch1 activity in the gastrulating mouse embryo. A: Amino acid sequence comparison of various Notch1 homologues spanning the γ-secretase cleavage site. The blue arrowhead indicates the S3 cleavage site preceding V1744, the amino terminal amino acid of N1ICD. This S3 cleavage site is conserved in mouse, human, and chick Notch1; zebrafish Notch1a; and C. elegans glp1, but not in Drosophila Notch and zebrafish Notch1b, where it is shifted one amino acid (green arrowhead). Boxes mark conserved amino acid stretches; identical amino acids appear in red. TM, transmembrane region; NICD, Notch intracellular domain. B: Western blot of embryonic day (E) 9.5 and E13.5 mouse embryos probed with anti-N1ICD (V1744) antibody, showing a 110-kDa N1ICD band in different tissues (top). Western blot from several mammary tumor cell lines (bottom). Note that only the highly invasive MDA-MB231 line expressed N1ICD. SMC-3 is a 140-kDa cohesin used as loading control. C: Planes of sections shown in D-K. D,E: Nuclear N1ICD staining (red) in the intraembryonic mesoderm region (iem, arrow) of the E7.0 wild-type (wt) embryo. Note that headfold region (hf) and embryonic ectoderm (ee) are negative. F: Detail of allantois with developing vessel expressing N1ICD (arrowhead). G: At E7.5, N1ICD is expressed in primitive endocardium (ec), cells of the cephalic mesenchyme (cm), amnion (am), and allantois (al). H: Detail of headfold region showing N1ICD staining in primitive endocardium (ec). ne, neuroectoderm; cm, cephalic mesenchyme. I: Detail showing N1ICD expression in blood island (bli) precursors. J: At E7.7, N1ICD is expressed in endocardium, cephalic mesenchyme and amnion (am). K: Detail of J, showing N1ICD expression in endocardium and primordium of dorsal aorta (da). Nuclei are counterstained with 4′,6-diamidine-2-phenylidole-dihydrochloride (DAPI, blue). Scale bars = 150 μm in D,G,J, 60 μm in E,F,H,I,K. |
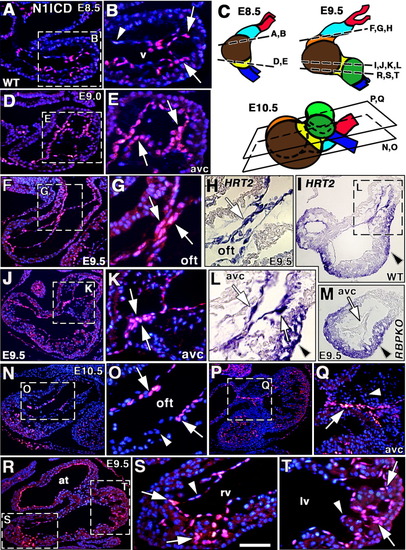
Endocardial Notch1 activity precedes valve primordia formation and trabeculation. A: N1ICD expression in ventricular endocardium of an embryonic day (E) 8.5 wild-type (wt) embryo. B: Detail showing N1ICD expression in endocardial cells (arrows) adjacent to myocardium. The distal endocardial cells express low N1ICD levels (arrowhead). v, ventricle. C: Schematic diagrams depicting E8.5-E10.5 heart, showing section planes analyzed. Outflow tract (OFT, light blue), left (brown) and right (orange) ventricles, atrioventricular canal (AVC, yellow), atria (dark green), and arterial (red) and venous (dark blue) poles. D,E: N1ICD expression in endocardial cells of the AVC (arrows). Arrows in (E) point to AVC endocardium where N1ICD expression is highest. F,G: N1ICD expression in endocardium of the OFT (arrows in G) at E9.5. H: HRT2 mRNA expression in the OFT endocardium (arrow) at E9.5. I,L: HRT2 transcription in the endocardium of the AVC (arrows in L). Note HRT2 expression in myocardium (arrowheads in I, L). J,K: N1ICD expression in endocardium of the AVC (arrows in K). M: HRT2 expression is reduced in the AVC endocardium of RBPJk mutants (arrow) but not in myocardium (arrowhead). N,O: At E10.5, N1ICD expression persists in specific endocardial cells of the OFT (arrows), while neighboring cells are negative (arrowhead). P,Q: AVC endocardial cells express N1ICD (Q, arrow), but transformed mesenchyme cells do not (Q, arrowhead). R-T: N1ICD expression in endocardium of atrium (at) and ventricles at E9.5. S,T: Details of right (rv) and left (lv) ventricles. Note predominant N1ICD expression in endocardium at the base of trabeculae (arrows) and reduced N1ICD expression in distal endocardium (arrowheads). Signal is stronger in the right ventricle. Scale bars = 30 μm in A,D,F,I,J,M,N,P,R, 100 μm in B,E,G,H,K,L,O,Q,S,T. |
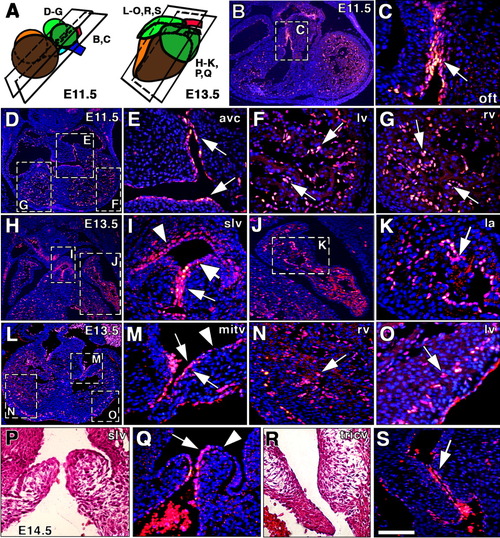
Endocardial Notch1 activity in cardiac valves, and atrial and trabecular development. A: Scheme showing the approximate plane of sections shown in B-S. B,C: General view of an embryonic day (E) 11.5 heart section at the level of the outflow tract (OFT). C: Nuclear N1ICD staining is particularly strong in the OFT endocardium (arrow). D-G: General view of a section at the atrioventricular canal (AVC) level with strong endocardial N1ICD expression (E, arrows). Trabecular endocardium of the left (F) and right (G) ventricles expressed high N1ICD levels (arrows). H,I: At E13.5, N1ICD staining persists in endocardium of the semilunar valve (slv; I, arrow), but decreased in arterial endothelium (I, thick arrow), and was detected in smooth muscle cells of the arterial wall (I, arrowhead). J,K: Detail of N1ICD staining in endocardium lining the developing trabeculae in the left atrium (la; arrow in K). L: General view of an E13.5 heart at the AV valves level. M: Detail showing N1ICD expression in endocardium of the mitral valve (mitv; arrows) and reduced staining in the valve component facing the atrium (arrowhead). N: Detail of N1ICD endocardial staining in the right ventricle (arrow). O: N1ICD staining was also strong in the developing coronary vessels of the left ventricle (arrow). P-S: At E14.5, N1ICD was restricted to the endocardial component of the valves. P: Morphology of the semilunar valve. Q: Note N1ICD endocardial expression (arrow) and its exclusion from the arterial endothelium (arrowhead) of the semilunar valve. R: Morphology of the tricuspid valve (tricv). S: N1ICD expression in endocardial lining of the tricuspid valve (arrow). Scale bars = 250 μm in B,D, 200 μm in H,L, 100 μm in C,E-G, 80 μm in I-K,M-S. |
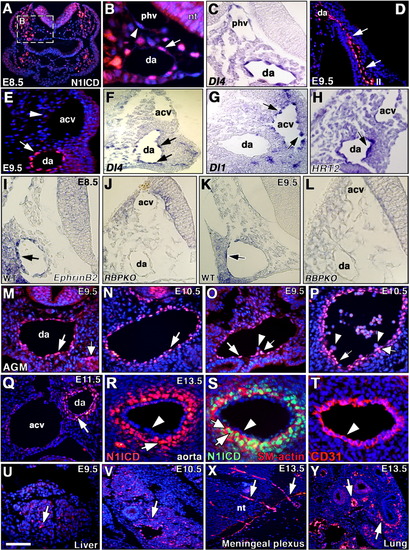
Notch1 activity in vascular development and hematopoiesis. A: General view of a cross-section of an embryonic day (E) 8.5 wild-type (wt) embryo. B: Detail showing N1ICD expression in endothelial cells of dorsal aorta (da, arrow), while cells of the primary head vein (phv, arrowhead) are negative. nt, neural tube. C: Detail showing predominant Delta4 transcription in dorsal aorta. D: Detail showing N1ICD staining in the endothelium (arrows) connecting the dorsal aorta with the second arterial arch (II). E: Detail of an E9.5 section showing N1ICD expression in dorsal aorta (arrow), and lack of expression in anterior cardinal vein (acv, arrowhead). F: Delta4 transcription in E9.5 arterial endothelium (arrows). G: Delta1 transcription in E9.5 venous endothelium (arrows). H: HRT2 transcription in E9.5 arterial endothelium (arrow). I,K: EphrinB2 transcription in arterial endothelium (arrows indicate dorsal aorta) of an E8.5-E9.5 wt embryo. J,L: EphrinB2 transcription is greatly reduced in arterial endothelium of RBPJk mutants. M,N: N1ICD expression in aorta endothelium of anterior AGM region at E9.5-E10.5 (arrows). M: The thick arrow in M indicates the urogenital ridge. O,P: N1ICD expression in endothelium and hematopoietic clusters in posterior AGM region at E9.5-E10.5. Note N1ICD staining in cluster cells closer to the aorta endothelium (thick arrow in O, P), but not in cells budding from the aorta (arrowheads in O, P). Q: At E11.5, N1ICD expression in arterial endothelium begins to disappear, while smooth muscle cells are stained (arrow) and endothelium of anterior cardinal vein (acv) is negative. da, dorsal aorta. R: In E13.5 embryos, N1ICD expression has disappeared from aorta endothelium (arrowhead), while the smooth muscle cells surrounding the artery express N1ICD (arrow). S: Smooth muscle cells showing nuclear N1ICD staining (green, arrow) and cytoplasmic SM-actin staining (red, thick arrow). The arterial endothelium is negative (arrowhead). T: Arterial endothelium stained with anti-CD31/PECAM antibody (red, arrowhead). U,V: N1ICD is expressed in the vasculature of the liver primordium (arrows) at E9.5-E10.5. X,Y: At E13.5, N1ICD stains the vasculature of the meningeal plexus (X, arrows) and arteries of pulmonary vasculature (Y, arrows). nt, neural tube. All are transverse sections. Scale bars = 200 μm in A, 35 μm in B-D,M-Q,U, 50 μm in E-L,Y, 100 μm in R, 45 μm in S,V,Y, 40 μm in T, 80 μm in X. |
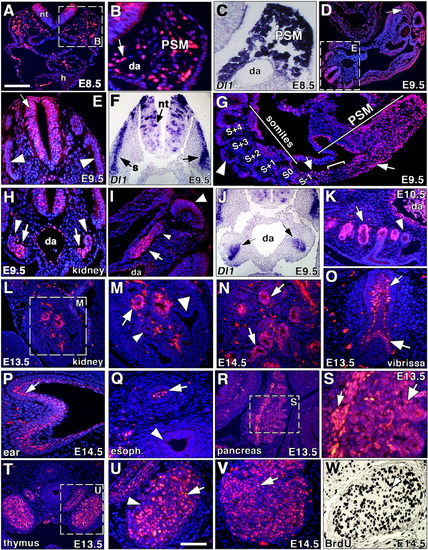
N1ICD expression in somitogenesis and in different organ systems. A-W: Somitogenesis (A-G), urogenital system (H-N), vibrissae (O), ear epithelium (P), esophagus (Q), pancreas (R,S), thymus (T-W). A,B: General view (A) and detail (B) of a transversal section at embryonic day (E) 8.5 showing the neural tube (nt), heart (h), presomitic mesoderm (PSM), and dorsal aorta (da) stained for N1ICD. B: Arrow points to a N1ICD-positive cell. The section level is similar to that shown in Figure 2A. C: Sectioned whole-mount in situ hybridization (WISH) showing Delta1 transcription in PSM. D: General view of the tail region of an embryonic day (E) 9.5 embryo. The arrow indicates the PSM. E: Detail showing N1ICD expression in the neural tube (arrow) and lack of expression in the somites (arrowheads). F: Delta1 transcription in the somites (s, arrows) and neural tube (nt, thick arrow) of an E9.5 embryo. G: Sagittal section of the tail region of a E9.5 embryo showing N1ICD expression in the posterior PSM (arrow) and around the cleft-forming area between S-1 and S0 (thick arrow), with almost no expression in the PSM between these two regions (bracket). H: Transverse section of the AGM region showing N1ICD expression in the nephric tubules (arrows), while the nephric ducts are negative (arrowheads). I: Sagittal section of the AGM region with expression in the nephric tubule (arrow) and no staining in nephric duct (arrowhead). Note no N1ICD expression in somites (thick arrowhead). J: Sectioned WISH showing Delta1 expression in nephric tubules (arrows) at E9.5. K: At E10.5, N1ICD is expressed in cells of the mesonephric tubule (arrow) and the mesonephric duct is negative (arrowhead). Note expression in the dorsal aorta (da). L: General view of the developing renal capsule at E13.5. M: Detail showing N1ICD expression restricted to metanephric vesicles (arrow), while metanephric ducts are negative (arrowheads). N: At E14.5, N1ICD expression localizes to primitive glomerulae (arrows). O: N1ICD expression in the hair plug (arrow) and dermal condensation primordia of vibrissa (thick arrow). P: N1ICD expression in ear epidermis (arrow). Q: N1ICD expression in esophagus epithelium (arrow) and lack of signal in trachea (arrowhead). R: General view of a transverse section of the pancreas at E13.5. S: Detail showing N1ICD expression in the pancreatic artery endothelium (arrow) and acini (thick arrow). T: General view of a transverse section of E13.5 thymus. U: Detail showing N1ICD expression in thymocytes (arrow) surrounded by epithelial cells (arrowhead) that do not express N1ICD. V: Detail of a thymic lobule at E14.5, showing N1ICD-stained thymocytes (arrow). W: Detail showing proliferating BrdU-positive cells in at E14.5. Scale bars = 30 μm in A,E,F,H,-K,P-R, 15 μm in B,C, 200 μm in D,G, 60 μm in L, 40 μm in M,N, 50 μm in O, 10 μm in S, 35 μm in T, 15 μm in U, 20 μm in V,W. |
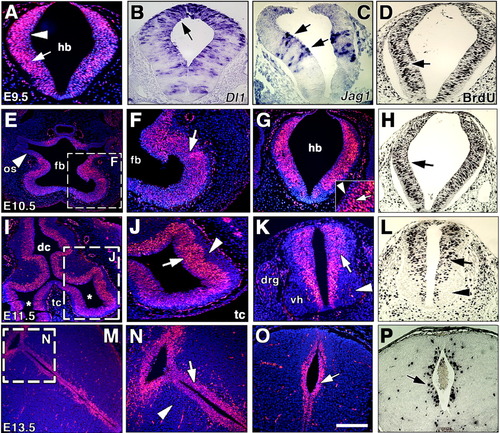
N1ICD expression and cell proliferation during central nervous system development. A-P: N1ICD expression (A,E,F,G,I-K,M-O), in situ hybridization (B,C), bromodeoxyuridine (BrdU) staining (D,H,L,P). A: At embryonic day (E) 9.5, N1ICD stains preferentially hindbrain cells in the abluminal region (arrow), and to a lesser extent those closest to the neural canal lumen (arrowhead). B,C: Delta1 (B) transcription is predominant in the dorsal region (arrow) and Jag1 (C) is transcribed in two stripes (arrows) on either side of the midline. D: At E9.5, BrdU staining in hindbrain is predominant in the abluminal region (arrow). E: An E10.5 embryo sectioned at the forebrain (fb) level. N1ICD staining is widespread in the neuroepithelium, except in the optic stalk (os, arrowhead). F: Detail showing N1ICD expression (arrow) in forebrain. G: In the hindbrain region, N1ICD is expressed in the neuroepithelium (arrow in inset) and is excluded from the cells closer to the lumen (arrowhead). H: BrdU staining in the hindbrain is relatively similar to N1ICD expression. I: General view at E11.5 of the forebrain region with telencephalic vesicles (tc; *) and diencephalon (dc). J: Detail of one vesicle. Note predominant N1ICD expression in nuclei closer to the ventricular zone (arrow) and its exclusion from the distal region (arrowhead). K: N1ICD expression in ependymal layer (arrow) of the spinal cord and condensing dorsal root ganglia (drg). No expression is detected in postmitotic ventral horn (vh) cells (arrowhead). L: BrdU staining at E11.5 reveals a pattern similar to that of N1ICD. M: General view of diencephalon at E13.5. N: Detail showing N1ICD staining in neuroepithelial cells closer to the neural canal (arrow), while distal cells are negative (arrowhead). O,P: In the spinal cord, N1ICD expression is restricted to the ventricular zone (arrow in O) in a pattern similar to BrdU staining (P). All are transverse sections. Scale bars = 300 μm in A-D, 500 μm in E-H,J-L,N-P, 0.8 mm in I; 1 mm in M. |
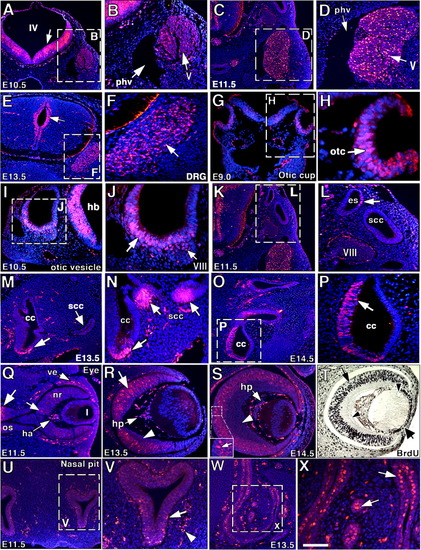
Notch1 activity in peripheral nervous system (PNS) and sense organ development. (A-F) PNS, (G-P) inner ear, (Q-T) eye, (U-X) nose. A: General view of the central nervous system (CNS) at embryonic day (E) 10.5, at the level of the trigeminal ganglion. IV, fourth ventricle. Note strong N1ICD signal in ventricular zone (arrow). B: Detail showing N1ICD expression in trigeminal ganglion (V, arrow) and lack of signal in the primary head vein (phv, arrow). C,D: N1ICD staining in trigeminal ganglion at E11.5 with detail in (D). E,F: General view of spinal cord at E13.5, showing N1ICD expression in the ventricular zone (arrow) and dorsal root ganglia (DRG, F), where N1ICD-expressing cells (arrow) and nonexpressing cells are mixed (F). G,H: At E9.0, the invaginating otic cup (otc, arrow) expresses N1ICD. I,J: At E10.5, the ventral region of the otic vesicle (arrow) and cells of the acoustic ganglion complex (VIII) express N1ICD (arrows). K,L: At E11.5, N1ICD expression in the inner ear is restricted to specific cells of the endolymphatic sac (es, arrow), but the semicircular canal (scc) is negative. M: At E13.5, neuroepithelial cells in the cochlear canal (cc) express N1ICD (arrow), but the semicircular canal (thick arrow) remains negative. N: Higher magnification showing positive N1ICD staining in sensory cells of cochlea (arrow) and semicircular canal (thick arrows). O: General view of inner ear at E14.5. P: Detail showing N1ICD expression in neuroepithelium of the cochlear canal (arrow). Q: At E11.5, N1ICD staining is weakly expressed in the neural retina (nr, arrow). Signal is also detected in the optic stalk (os, arrow), hyaloid artery (ha, arrow) and vasculature around the eye. l, lens. R,S: At E13.5-E14.5, N1ICD staining is observed throughout the distal neural retina (arrow and inset in S) and hyaloid plexus (hp), but is excluded from the central retinal region (arrowheads). T: BrdU staining is restricted to the neural retina (arrow) and lens epithelium (thick arrow) and is excluded from central neural retina and lens fibers (arrowheads). U: General view of nasal pit region at E11.5. V: Detail showing N1ICD expression in nasal epithelium (arrow) and in surrounding vessels (arrowhead). W,X: General view of primitive nasal cavity at E13.5 (W) and detail showing N1ICD staining in serous gland (X, arrows). Scale bars = 600 μm in A,K,N, 250 μm in B,C,G,S,T, 150 μm in D, 1.2 mm in E, 350 μm in F, 80 μm in H, 300 μm in I,L, 150 μm in J, 800 μm in M, 1 mm in O, 500 μm in P, 200 μm in Q,R, 600 μm in U, 400 μm in V,W, 180 μm in X. |
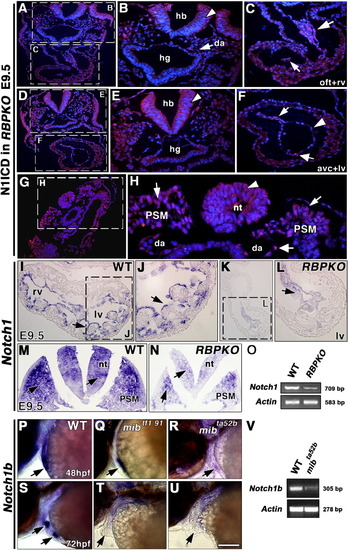
Abrogation of Notch1-dependent signaling activity in mouse and zebrafish Notch pathway mutants. A-H: Embryonic day (E) 9.5 RBPJk mutants. A: General view of a transverse section stained with the anti-N1ICD (V1744) antibody. Section level is similar to that shown in Figure 2A. B: Detail showing the hindbrain (hb), hindgut (hg), and the collapsed dorsal aorta (da). Weak N1ICD expression is observed in the dorsal aorta (arrow), and no expression is detected in hb (arrowhead). C: Detail showing weak N1ICD expression in the outflow tract (OFT, large arrow) and right ventricle (rv, arrow) endocardium. D: General view of a transverse section at a more caudal level, similar to that shown in Figure 2D. E: Detail showing lack of N1ICD expression in hb (arrowhead). F: Detail showing very faint N1ICD expression in the atrioventricular canal (AVC, arrow) and left ventricle (lv, thick arrow) endocardium, where the majority of cells do not express N1ICD (arrowhead). G: General view of a transverse section at the level of the presomitic mesoderm (PSM). H: Detail showing very reduced N1ICD staining in PSM (arrows), da (thick arrow), and lack of staining in the neural tube (arrowhead). I-L: Notch1 Whole-mount in situ hybridization (WISH) analysis of E9.5 hearts. I,J: Notch1 is transcribed throughout the ventricular endocardium of the wild-type (wt) embryo (I); detail of left ventricle (lv, arrow in J). K,L: RBPJk mutants show reduced Notch1 transcription in ventricular endocardium (arrow in L). M: Notch1 transcription in E9.5 wt PSM and neural tube region (arrows in M) and marked reduction in E9.5 RBPJk mutants (N). O: Semiquantitative reverse transcriptase-polymerase chain reaction (RT-PCR) analysis of Notch1 transcription in E9.5 wt and RBPJk mutants. P-U: Notch1b WISH analysis of 48 hpf-72 hpf zebrafish embryos. P: Detail of the cardiac region of a 48 hpf wt embryo. The arrow indicates cardiac expression of Notch1b. Q,R: Detail of the cardiac region of 48 hpf mibtf191 (Q) and mibta52b (R) mutants showing reduced Notch1b transcription (arrows). S: Detail of the cardiac region of a 72 hpf wt embryo showing Notch1b expression restricted to valvular primodia (arrows). T,U: Detail showing very reduced cardiac Notch1b transcription in 72 hpf mibtf191 (T) and mibta52b (U) mutants (arrows). V: Semiquantitative RT-PCR analysis of Notch1b transcription in 72 hpf wt and mibta52b mutants. Scale bars = 100 μm in A,D,G,I,K,M,N, 40 μm in B,C,E,F,J,L, 30 μm in H, 125 μm in P-U. EXPRESSION / LABELING:
|