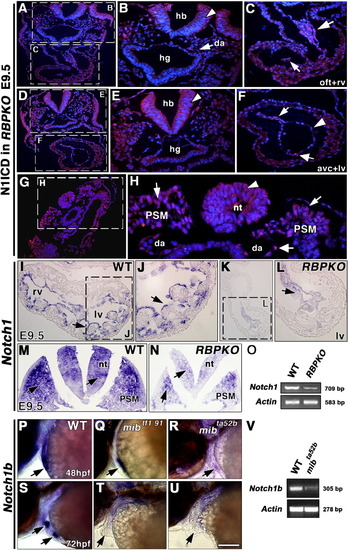
Abrogation of Notch1-dependent signaling activity in mouse and zebrafish Notch pathway mutants. A-H: Embryonic day (E) 9.5 RBPJk mutants. A: General view of a transverse section stained with the anti-N1ICD (V1744) antibody. Section level is similar to that shown in Figure 2A. B: Detail showing the hindbrain (hb), hindgut (hg), and the collapsed dorsal aorta (da). Weak N1ICD expression is observed in the dorsal aorta (arrow), and no expression is detected in hb (arrowhead). C: Detail showing weak N1ICD expression in the outflow tract (OFT, large arrow) and right ventricle (rv, arrow) endocardium. D: General view of a transverse section at a more caudal level, similar to that shown in Figure 2D. E: Detail showing lack of N1ICD expression in hb (arrowhead). F: Detail showing very faint N1ICD expression in the atrioventricular canal (AVC, arrow) and left ventricle (lv, thick arrow) endocardium, where the majority of cells do not express N1ICD (arrowhead). G: General view of a transverse section at the level of the presomitic mesoderm (PSM). H: Detail showing very reduced N1ICD staining in PSM (arrows), da (thick arrow), and lack of staining in the neural tube (arrowhead). I-L: Notch1 Whole-mount in situ hybridization (WISH) analysis of E9.5 hearts. I,J: Notch1 is transcribed throughout the ventricular endocardium of the wild-type (wt) embryo (I); detail of left ventricle (lv, arrow in J). K,L: RBPJk mutants show reduced Notch1 transcription in ventricular endocardium (arrow in L). M: Notch1 transcription in E9.5 wt PSM and neural tube region (arrows in M) and marked reduction in E9.5 RBPJk mutants (N). O: Semiquantitative reverse transcriptase-polymerase chain reaction (RT-PCR) analysis of Notch1 transcription in E9.5 wt and RBPJk mutants. P-U: Notch1b WISH analysis of 48 hpf-72 hpf zebrafish embryos. P: Detail of the cardiac region of a 48 hpf wt embryo. The arrow indicates cardiac expression of Notch1b. Q,R: Detail of the cardiac region of 48 hpf mibtf191 (Q) and mibta52b (R) mutants showing reduced Notch1b transcription (arrows). S: Detail of the cardiac region of a 72 hpf wt embryo showing Notch1b expression restricted to valvular primodia (arrows). T,U: Detail showing very reduced cardiac Notch1b transcription in 72 hpf mibtf191 (T) and mibta52b (U) mutants (arrows). V: Semiquantitative RT-PCR analysis of Notch1b transcription in 72 hpf wt and mibta52b mutants. Scale bars = 100 μm in A,D,G,I,K,M,N, 40 μm in B,C,E,F,J,L, 30 μm in H, 125 μm in P-U.
|
