
Fig. 2
- ID
- ZDB-FIG-070911-51
- Publication
- Del Monte et al., 2007 - Monitoring Notch1 activity in development: Evidence for a feedback regulatory loop
- Other Figures
- All Figure Page
- Back to All Figure Page
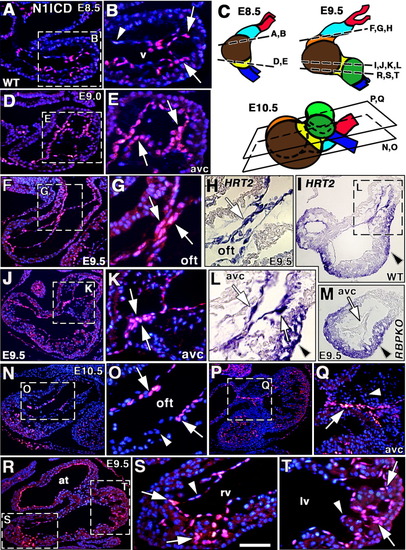
Endocardial Notch1 activity precedes valve primordia formation and trabeculation. A: N1ICD expression in ventricular endocardium of an embryonic day (E) 8.5 wild-type (wt) embryo. B: Detail showing N1ICD expression in endocardial cells (arrows) adjacent to myocardium. The distal endocardial cells express low N1ICD levels (arrowhead). v, ventricle. C: Schematic diagrams depicting E8.5-E10.5 heart, showing section planes analyzed. Outflow tract (OFT, light blue), left (brown) and right (orange) ventricles, atrioventricular canal (AVC, yellow), atria (dark green), and arterial (red) and venous (dark blue) poles. D,E: N1ICD expression in endocardial cells of the AVC (arrows). Arrows in (E) point to AVC endocardium where N1ICD expression is highest. F,G: N1ICD expression in endocardium of the OFT (arrows in G) at E9.5. H: HRT2 mRNA expression in the OFT endocardium (arrow) at E9.5. I,L: HRT2 transcription in the endocardium of the AVC (arrows in L). Note HRT2 expression in myocardium (arrowheads in I, L). J,K: N1ICD expression in endocardium of the AVC (arrows in K). M: HRT2 expression is reduced in the AVC endocardium of RBPJk mutants (arrow) but not in myocardium (arrowhead). N,O: At E10.5, N1ICD expression persists in specific endocardial cells of the OFT (arrows), while neighboring cells are negative (arrowhead). P,Q: AVC endocardial cells express N1ICD (Q, arrow), but transformed mesenchyme cells do not (Q, arrowhead). R-T: N1ICD expression in endocardium of atrium (at) and ventricles at E9.5. S,T: Details of right (rv) and left (lv) ventricles. Note predominant N1ICD expression in endocardium at the base of trabeculae (arrows) and reduced N1ICD expression in distal endocardium (arrowheads). Signal is stronger in the right ventricle. Scale bars = 30 μm in A,D,F,I,J,M,N,P,R, 100 μm in B,E,G,H,K,L,O,Q,S,T. |