
|
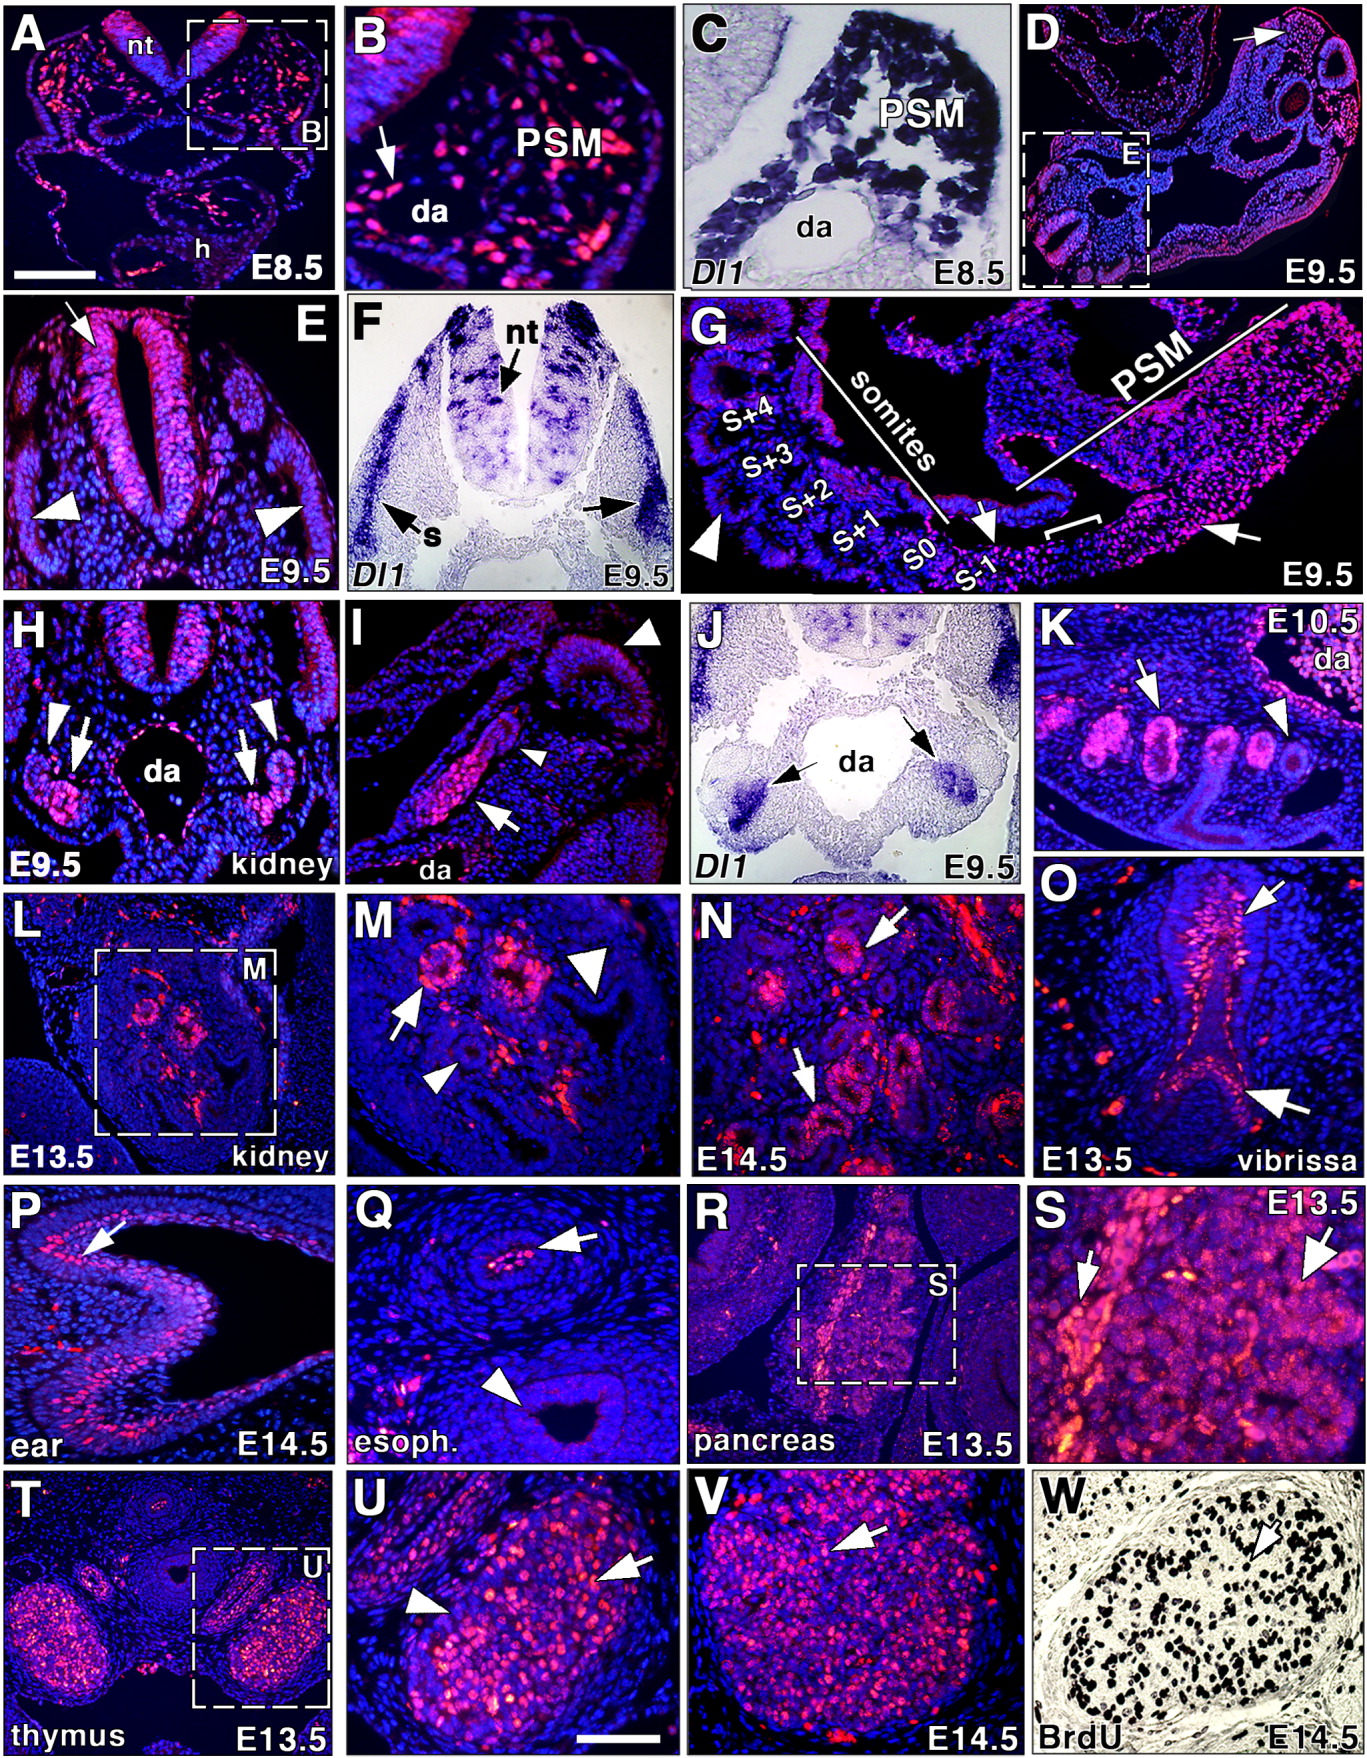
Fig. 5 N1ICD expression in somitogenesis and in different organ systems. A-W: Somitogenesis (A-G), urogenital system (H-N), vibrissae (O), ear epithelium (P), esophagus (Q), pancreas (R,S), thymus (T-W). A,B: General view (A) and detail (B) of a transversal section at embryonic day (E) 8.5 showing the neural tube (nt), heart (h), presomitic mesoderm (PSM), and dorsal aorta (da) stained for N1ICD. B: Arrow points to a N1ICD-positive cell. The section level is similar to that shown in Figure 2A. C: Sectioned whole-mount in situ hybridization (WISH) showing Delta1 transcription in PSM. D: General view of the tail region of an embryonic day (E) 9.5 embryo. The arrow indicates the PSM. E: Detail showing N1ICD expression in the neural tube (arrow) and lack of expression in the somites (arrowheads). F: Delta1 transcription in the somites (s, arrows) and neural tube (nt, thick arrow) of an E9.5 embryo. G: Sagittal section of the tail region of a E9.5 embryo showing N1ICD expression in the posterior PSM (arrow) and around the cleft-forming area between S-1 and S0 (thick arrow), with almost no expression in the PSM between these two regions (bracket). H: Transverse section of the AGM region showing N1ICD expression in the nephric tubules (arrows), while the nephric ducts are negative (arrowheads). I: Sagittal section of the AGM region with expression in the nephric tubule (arrow) and no staining in nephric duct (arrowhead). Note no N1ICD expression in somites (thick arrowhead). J: Sectioned WISH showing Delta1 expression in nephric tubules (arrows) at E9.5. K: At E10.5, N1ICD is expressed in cells of the mesonephric tubule (arrow) and the mesonephric duct is negative (arrowhead). Note expression in the dorsal aorta (da). L: General view of the developing renal capsule at E13.5. M: Detail showing N1ICD expression restricted to metanephric vesicles (arrow), while metanephric ducts are negative (arrowheads). N: At E14.5, N1ICD expression localizes to primitive glomerulae (arrows). O: N1ICD expression in the hair plug (arrow) and dermal condensation primordia of vibrissa (thick arrow). P: N1ICD expression in ear epidermis (arrow). Q: N1ICD expression in esophagus epithelium (arrow) and lack of signal in trachea (arrowhead). R: General view of a transverse section of the pancreas at E13.5. S: Detail showing N1ICD expression in the pancreatic artery endothelium (arrow) and acini (thick arrow). T: General view of a transverse section of E13.5 thymus. U: Detail showing N1ICD expression in thymocytes (arrow) surrounded by epithelial cells (arrowhead) that do not express N1ICD. V: Detail of a thymic lobule at E14.5, showing N1ICD-stained thymocytes (arrow). W: Detail showing proliferating BrdU-positive cells in at E14.5. Scale bars = 30 μm in A,E,F,H,-K,P-R, 15 μm in B,C, 200 μm in D,G, 60 μm in L, 40 μm in M,N, 50 μm in O, 10 μm in S, 35 μm in T, 15 μm in U, 20 μm in V,W.