
- Title
-
Setting the Tempo in Development: An Investigation of the Zebrafish Somite Clock Mechanism
- Authors
- Giudicelli, F., Ozbudak, E.M., Wright, G.J., and Lewis, J.
- Source
- Full text @ PLoS Biol.
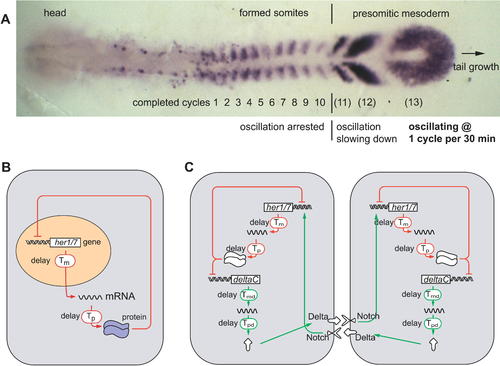
Mapping of Temporal Oscillations into a Spatial Wave Pattern during Somite Segmentation, and a Model of the Oscillator Mechanism (A) The expression pattern of the oscillating gene deltaC in a zebrafish embryo at the ten-somite stage. (B) In each cell of the presomitic mesoderm, it is proposed that a her1 or her7 autoinhibition negative feedback loop generates oscillations. (C) Communication via the Delta-Notch pathway is proposed to keep oscillations in adjacent cells synchronized. The oscillations depend critically on the delays (Tm, Tp, Tmd, and Tpd) in the feedback loops. (A–C) are slightly modified from [25]. EXPRESSION / LABELING:
|
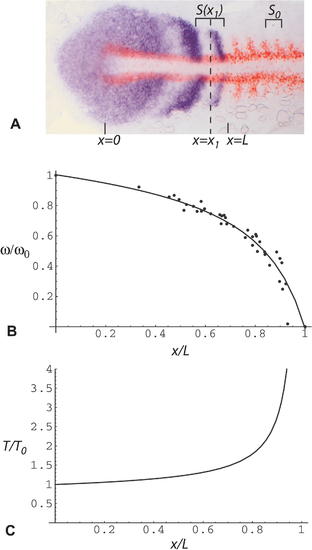
Estimation of Clock Rate ω(x) and Period T(x) as a Function of Distance x along the PSM (A) Flat mount of a seven-somite embryo stained by ISH for her1 (purple, NBT/BCIP detection chemistry) to show the oscillation pattern and for myoD (red, Fast Red detection chemistry) as a marker of formed somites. Spatial wavelength as a function of position, S(x), is measured as the interval between one her1 peak and the next, or one trough and the next, where x is the midpoint of that interval. S0 is the width of one formed somite. Position x = 0 corresponds to the tail end of the notochord, and position x = L corresponds to the anterior end of the PSM. (B and C) Clock frequency ω(x) and period T(x) as a function of distance x along the PSM. Each data point corresponds to one measurement of spatial wavelength S(x). The graph represents data from ten different, randomly chosen specimens of the type shown in (A) fixed at the 7–15-somite stages. The line (a hyperbola) is a least-squares fit to the data. To combine data from different specimens, distances are scaled relative to the length of the PSM. Clock rate and period are calculated for each data point according to the Equation 2 shown in the text. We use a simple linear approximation for u(x), the speed of forward movement of the cells along the anteroposterior axis relative to the tail end of the notochord: by definition, at x = 0, u(x) = 0, and at x/L = 1, u(x) = 1 (in somite lengths per somite cycle), so we assume u(x) = x/L at intermediate values of x. EXPRESSION / LABELING:
|
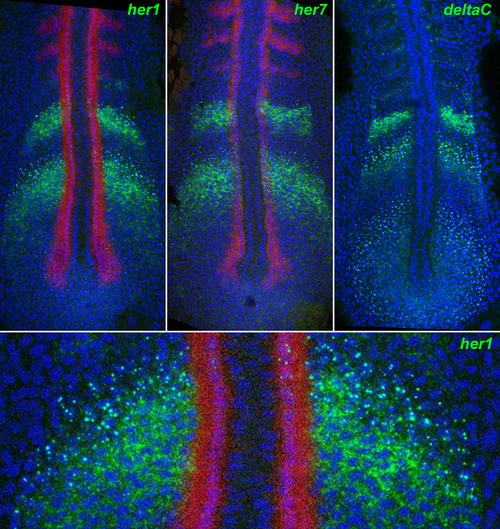
Nascent and Mature Transcripts Visualized by In Situ Hybridisation. Fluorescent staining by ISH for her1 (top left), her7 (top middle), and deltaC (top right), using tyramide chemistry (green), reveals nuclear dots corresponding to nascent transcripts and cytoplasmic signal corresponding to mature mRNA. The bottom panel is a magnified detail of the top left panel. The images are confocal optical sections of flat-mounted specimens, counterstained for DNA with TOPRO3 (blue false colour). Red staining shows myoD expression by dual ISH. EXPRESSION / LABELING:
|
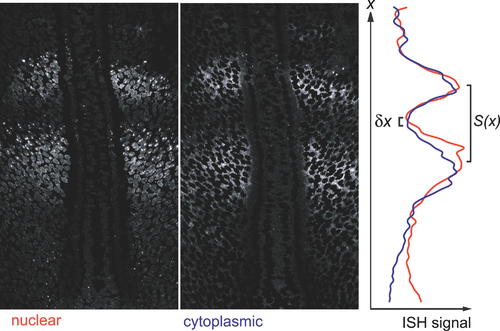
Estimation of Transcriptional Delay from In Situ Hybridisation Pattern. The spatial offset between the anterior margin of the band of nuclear dots and the anterior margin of the band of cytoplasmic signal in specimens stained as in Figure 3 gives a measure of the transcriptional delay. To measure this offset, we used Photoshop to generate from the image of each specimen a pair of pictures, one (left-hand panel) showing only the ISH signal that was nuclear (i.e., co-localized with DNA staining), the other (middle panel) showing only the signal that was cytoplasmic (i.e., co-localized with an absence of DNA staining); note, however, that because of the non-zero thickness of the optical section, the “nuclear” signal includes a sizeable contribution from cytoplasmic mRNA where the latter is plentiful. For each of these two images, we computed the smoothed mean intensity of staining as a function of distance x along the anteroposterior axis (see Materials and Methods), and plotted the results together on the same graph (right-hand panel). The delay from the beginning of the rise in nuclear signal to the beginning of the rise in cytoplasmic signal corresponds to the spatial offset δx between the minima of the red and blue curves. We converted this offset to a time interval using Equation 3 and the local values of x, L, S(x), and S0 measured from the same specimen. |
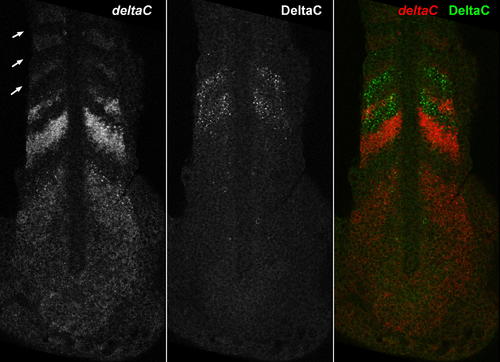
The Pattern of deltaC Transcripts Compared with the Pattern of DeltaC Protein in a Doubly Stained Specimen. The left-hand panel shows the distribution of deltaC mRNA, as revealed by ISH; arrows indicate the three most recently formed somites. The middle panel shows the distribution of DeltaC protein in the same optical section, immunostained with the zdc2 monoclonal antibody. The right-hand panel shows the two patterns superimposed in the doubly stained specimen. The protein pattern is shifted by almost exactly one somite width relative to the mRNA pattern; one somite cycle time earlier, the cells currently displaying peak levels of protein would have been in the locations of the cells currently expressing the peak levels of mRNA and would have been expressing those levels of mRNA themselves. Thus there is a delay of approximately one somite cycle time (30 min) from the accumulation of the mRNA in the cell to the accumulation of the protein translated from it. |
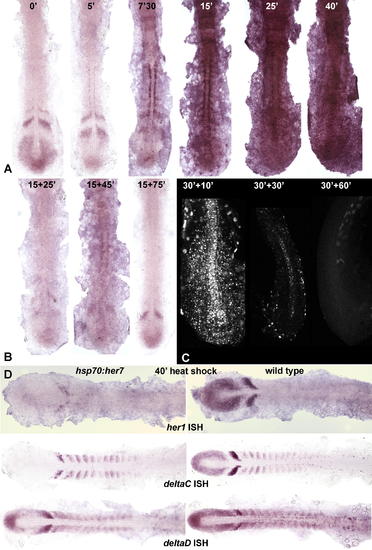
Effects of Heat Shock in hsp70:HA-her7 Transgenics. (A) Levels of her7 mRNA expression as shown by ISH (NBT/BCIP) in embryos fixed immediately after a 37 °C heat shock for the indicated numbers of minutes. (B) Levels of her7 mRNA in embryos given a 15-min heat shock followed by 25, 45, or 75 minutes of recovery; almost all her7 mRNA, including the product of the normal endogenous gene, has disappeared at the 15+25-min time point, implying that Her7 inhibits her7 expression. (C) Levels of HA-tagged Her7 protein, revealed by immunostaining with an anti-HA antibody, in embryos given a 30-min heat shock followed by 10, 30, or 60 min of recovery. (D) Effects on expression of her1, deltaC, and deltaD in embryos fixed immediately after a 40-min heat shock. hsp70:HA-her7 transgenics are shown on the left, wild-type sibling controls on the right. All specimens in this figure have been dissected off the yolk and flat mounted. EXPRESSION / LABELING:
|
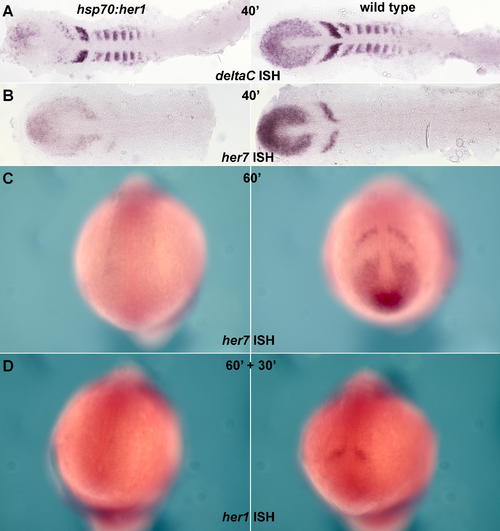
Effects of Heat Shock in hsp70:HA-her1 Transgenics (A and B) Embryos fixed immediately after a 40-min heat shock at 37 °C, and stained by ISH for deltaC or her7; the hsp70:HA-her1 transgenics are on the left, wild-type sibling controls on the right. The stripy expression of deltaC and her7 in the PSM is reduced, but not eliminated, by the forced expression of Her1, suggesting that oscillation continues. (C) Heat shock of hsp70:HA-her1 embryos prolonged for 60 min reduces her7 expression to undetectable levels. (D) Heat shock of hsp70:HA-her1 embryos for 60 min followed by 30 min recovery reveals a loss of endogenous her1 expression, implying that her1, like her7, is autoinhibitory. (A) and (B) are flat mounts; (C) and (D) are whole mounts. EXPRESSION / LABELING:
|
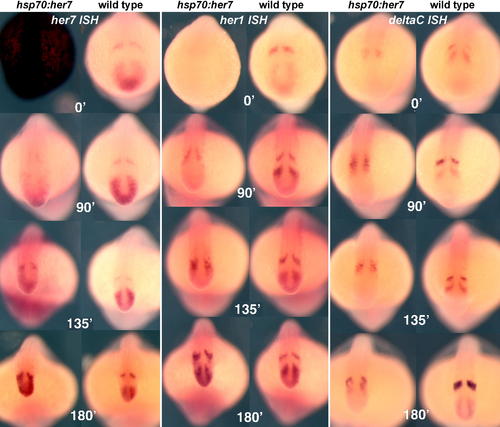
Recovery after Heat Shock in hsp70:HA-her7 Transgenics, Compared with Wild-Type Sibling Controls. All embryos were heat shocked at 37 °C for 60 min (beginning at the six-somite stage), followed by a recovery period of 0, 90, 135, or 180 min as indicated. They were then fixed and processed by ISH with probes for her7, her1, or deltaC. All these specimens are whole mounts. EXPRESSION / LABELING:
|
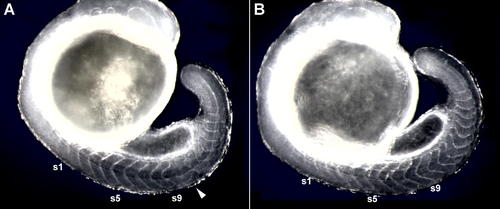
Delayed Somite Segmentation Defects following a Heat-Shock–Induced Pulse of HA-Her7. The photographs show effects of a 60-min heat shock at 37 °C initiated at the five-somite stage, followed by 7 h of recovery at the normal incubation temperature, for (A) an hsp70:HA-her7 transgenic and (B) a wild-type sibling control. In the transgenic, four somites (s6 to s9) have formed normally after the onset of heat shock, but a block of somites subsequent to that has been disrupted (arrowhead). Embryos are lightly fixed, but unstained, and viewed with dark-field illumination. |