
- Title
-
Notch signaling regulates midline cell specification and proliferation in zebrafish
- Authors
- Latimer, A.J., and Appel, B.
- Source
- Full text @ Dev. Biol.
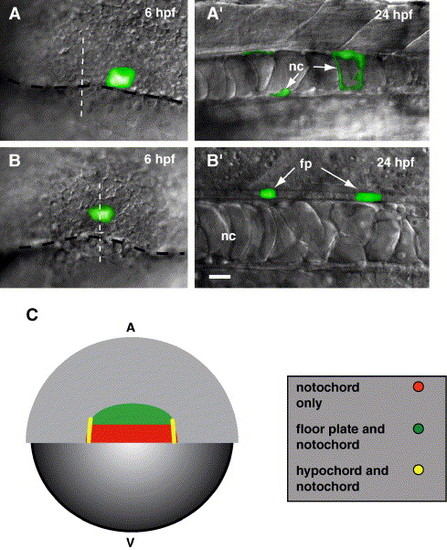
Midline precursor cells arise from shield domains. Embryos shown in (A′) and (B′) are later stages of the embryos shown in panels A and B, respectively. (A) View of the dorsal margin region of a 6 hpf embryo. Caged fluorescein was photoactivated in 3–5 cells at the margin (black dashed line), near the midline (white dashed line). (A′) Side view of the trunk region of a living embryo at 24 hpf showing labeled notochord (nc) cells. (B) View of the dorsal margin region of a 6 hpf embryo. Cells were labeled approximately 4 cell diameters above the margin (black dashed line) at the midline (white dashed line). (B′) Side view of the trunk region of a living embryo at 24 hpf showing labeled floor plate (fp) cells. (C) Representative schematic of our fate mapping experiments (also see Table 1). The schematic depicts a dorsal view of a 6 hpf embryo, blastoderm is animal (A) and yolk is vegetal (V). We previously showed (Latimer et al., 2002) that hypochord precursor cells (yellow) are located at the lateral edges of the shield. Floor plate precursor cells (green) are located in a region approximately 4–8 cell diameters above the margin. Notochord precursor cells (red) are primarily found directly at the dorsal margin, but were also labeled near hypochord and floor plate precursors. We never labeled floor plate within 4 cell diameters of the blastoderm margin. Scale bar: 20 μm for panels A–B′. |
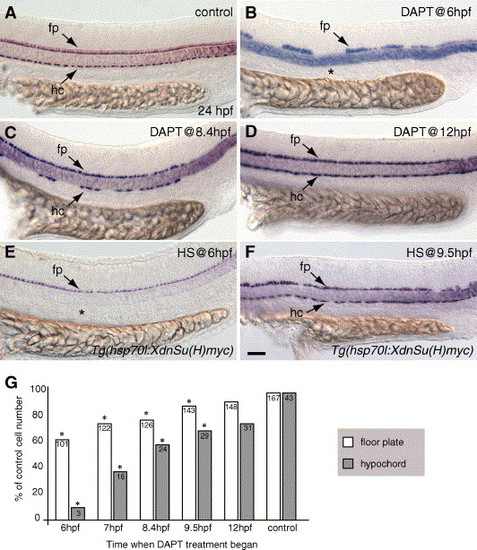
Notch signaling is required during gastrulation for hypochord specification and a complete floor plate. (A–F) Side views, anterior to the left, of 24 hpf embryos showing col2a1 expression in the floor plate (fp) and hypochord (hc). (A) Control embryo incubated in 1% DMSO showing normal floor plate and hypochord arrangement. (B) Embryo treated with DAPT at 6 hpf to block Notch signaling. Floor plate was reduced, whereas hypochord was absent (asterisk). (C) Embryo treated with DAPT at 8.4 hpf (80% epiboly, midgastrulation) showing fewer hypochord cells. Floor plate cells form a complete row but are fewer in number (see G). (D) Embryo treated with DAPT at 12 hpf (6-somite stage) showing complete rows of both hypochord and floor plate. (E) Tg(hsp70l:XdnSu(H)myc) embryo heat-shocked at 6 hpf had no hypochord cells (asterisk). (F) Tg(hsp70l:XdnSu(H)myc) embryo heat-shocked at 9.5 hpf developed a complete row of hypochord cells. (G) We counted the number of col2a1-expressing floor plate and hypochord cells between somite 1 and 17 in control embryos and embryos treated with DAPT at the different times indicated. Embryos treated with DAPT at 6 hpf had reduced floor plate and few hypochord cells, whereas embryos treated with DAPT at later times had less severe floor plate and hypochord defects. Floor plate and hypochord cells were counted in ten embryos per sample, and the average number of cells (number shown within each bar) is expressed as a percentage of the control value (100%). Asterisks (*) indicate significance beyond the 0.001 level using Student′s t test. Scale bar: 40 μm for panels A–F. EXPRESSION / LABELING:
|
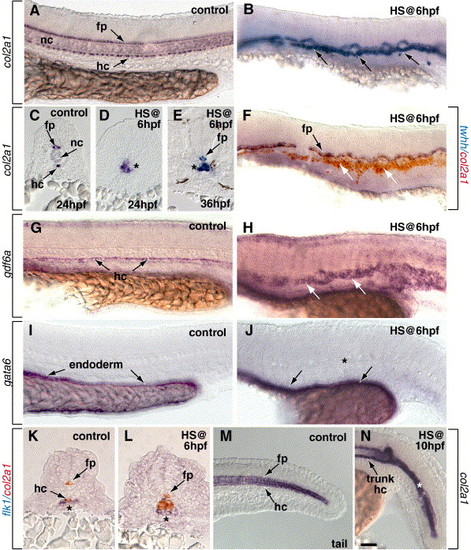
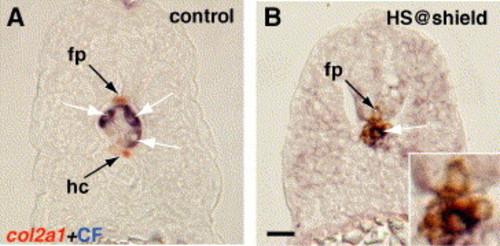
Activation of Notch signaling at 6 hpf promotes formation of trunk hypochord but not floor plate. All embryos except panel E are 24 hpf. (A, B, F–J, M, N) Side views with anterior to the left. (C–E, K, L) Transverse sections. (A–E) Embryos were probed for col2a1 expression, which marks floor plate (fp) and hypochord (hc) cells. (A) Control embryo showing normal trunk floor plate and hypochord. The notochord (nc) is located between the floor plate and hypochord. (B) Heat shock induction of NICD expression at 6 hpf expanded col2a1 expression (arrows). Note that the notochord appears reduced. (C) Control embryo showing normal location of col2a1-expressing floor plate and hypochord in transverse section. (D) After NICD induction at 6 hpf, col2a1 expression (asterisk) was expanded immediately ventral to the spinal cord, normally the position of the notochord. (E) At 36 hpf, col2a1-expressing cells replaced notochord (asterisk) following NICD induction at shield stage. (F) NICD induction at 6 hpf did not expand floor plate, marked by twhh expression, (black arrow), while excess col2a1-expressing cells formed below floor plate (white arrows). (G) Control embryo showing normal pattern of gdf6a-expressing hypochord cells (arrows). (H) gdf6a expression was expanded after NICD induction at 6 hpf. (I) Normal expression pattern of gata6 expression in trunk endoderm of control embryo (arrows). (J) gata6 expression appeared normal after NICD induction at 6 hpf. Note the absence of gata6 expression in the midline region (asterisk). (K, L) flk1 marks aorta precursor cells. Hypochord was not labeled by flk1 in either control embryos (K) or embryos that expressed NICD at 6 hpf (L). (M) Tail region of a control embryo showing normal col2a1 expression in the floor plate and hypochord and transient expression in the tail notochord. (N) Heat shock induction of NICD at 10 hpf did not expand trunk hypochord (arrow), but tail col2a1 expression was expanded and notochord appeared reduced (asterisk). Scale bar: 40 μm for panels A, B, F–J, M, N; 20 μm for panels C–E, K, L. |
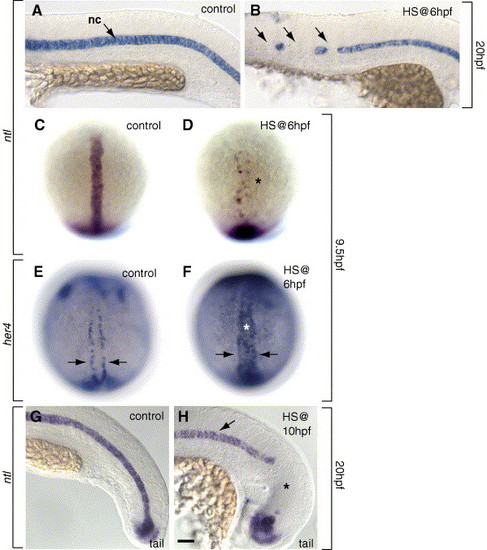
Notch signaling limits notochord and promotes hypochord development during gastrulation. (A, B, G, H) Side views, anterior to the left, at 20 hpf (22-somite stage) and (C, D) dorsal views, animal pole at top, at 9.5 hpf (YPC stage) showing ntl-expressing notochord cells. (A) Control embryo showing normal pattern of ntl-expressing notochord at the midline. (B) Expression of NICD at 6 hpf reduced trunk notochord (arrows). (C) Normal pattern of notochord precursors at 9.5 hpf. (D) The number of notochord precursors was reduced (asterisk) in embryos after induction of NICD at 6 hpf. (E, F) her4 expression in hypochord precursors at 9.5 hpf, dorsal view. (E) her4 was expressed in a row on both sides of the midline (arrows) in control embryos. (F) her4 was expressed throughout the midline (asterisk) after expression of NICD at 6 hpf. (G) Control embryo showing normal pattern of tail ntl expression in the notochord. (H) Expression of NICD at 10 hpf reduced tail notochord (asterisk), but trunk notochord appeared normal (arrow). Scale bar: 40 μm for panels A, B, G, H; 80 μm for panels E, F. |
Notch signaling drives trunk axial mesoderm to a hypochord cell fate. (A, B) 24 hpf, transverse sections, showing col2a1 expression combined with staining to show photoactivated fluorescein signal. Three to five cells were labeled by photoactivation of caged fluorescein at the dorsal margin in control embryos and embryos expressing NICD beginning just before 6 hpf. (A) Labeled cells were found in the notochord (white arrow) and never in col2a1-expressing hypochord. (B) Cells derived from the notochord precursor domain expressed col2a1 following heat shock activation of Notch at 6 hpf. Inset shows enlarged view of midline region. Scale bar: 10 μm for panels A, B. |
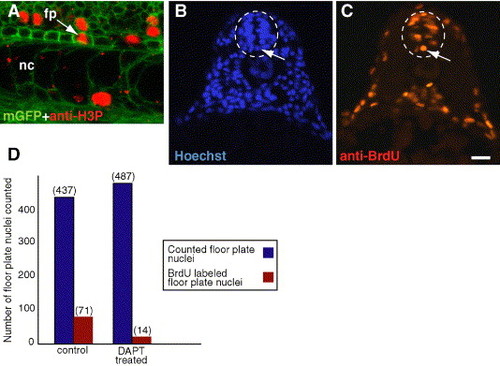
Notch signaling is required for floor plate proliferation. (A) Side view confocal image, anterior to the left and dorsal up, showing proliferating cells marked by anti-H3P antibody (red) in a 24 hpf Tg(β-actin:mgfp)VU119 embryo. Cells are outlined by expression of a membrane-tethered EGFP. The arrow points to a dividing floor plate cell. (B, C) Both images are from the same transverse section of a 19 hpf (20 somite stage) embryo treated with BrdU to label proliferating cells. (B) Hoechst staining labels all nuclei. Floor plate nuclei (arrow) are easily identifiable and are medially located in the most ventral aspect of the neural tube (white dashed oval). (C) Nucleus labeled by anti-BrdU antibody (arrow) showing that the floor plate cell in panels B was proliferating. (D) We analyzed transverse sections of control embryos treated with BrdU at 19 hpf and embryos treated with DAPT beginning at 16.5 hpf (15-somite stage) and subsequently treated with BrdU at 19 hpf. Blue bars indicate total floor plate nuclei counted in each sample. Red bars indicate the number of floor plate nuclei that were also labeled by anti-BrdU antibody. Scale bar: 13 μm for A; 20 μm for panels B, C. |
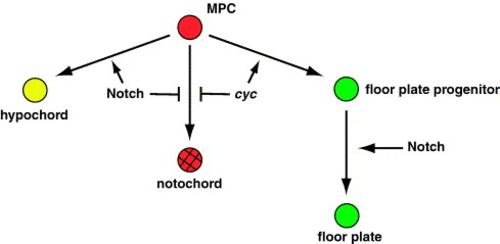
Model for Notch signaling among midline precursor cells. During gastrulation, Notch activation among ntl+ midline precursor cells (MPCs) inhibits notochord and promotes hypochord development. Meanwhile, Nodal signaling specifies floor plate progenitors. Later, Notch is required for the proliferation of floor plate progenitor cells. |
Reprinted from Developmental Biology, 298(2), Latimer, A.J., and Appel, B., Notch signaling regulates midline cell specification and proliferation in zebrafish, 392-402, Copyright (2006) with permission from Elsevier. Full text @ Dev. Biol.