
- Title
-
Mutation of the atrophin2 gene in the zebrafish disrupts signaling by fibroblast growth factor during development of the inner ear
- Authors
- Asai, Y., Chan, D.K., Starr, C.J., Kappler, J.A., Kollmar, R., and Hudspeth, A.J.
- Source
- Full text @ Proc. Natl. Acad. Sci. USA
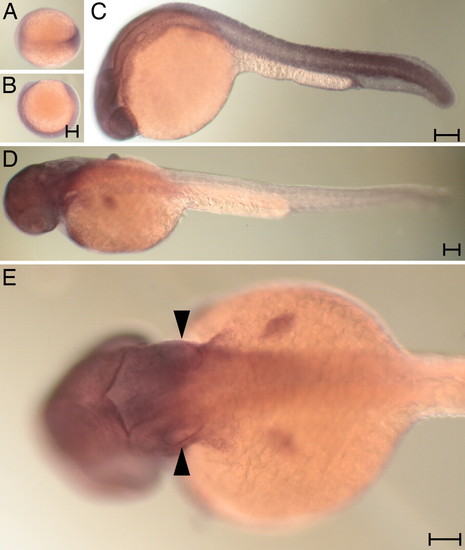
The expression pattern of the atrophin2 gene. Whole-mount in situ hybridization was conducted with a 32 probe at various developmental stages. (A and B) Labeling of the germ band is apparent in a dorsal (A) or a lateral view (B) of the late gastrula. (C) At 24 hpf, essentially all tissue except the yolk is labeled. (D) Labeling diminishes from the caudal extreme by 36 hpf. (E) Arrowheads highlight the labeling of the otic vesicles in a dorsal view of a larva at 36 hpf. (Scale bar: 100 μm.) EXPRESSION / LABELING:
|
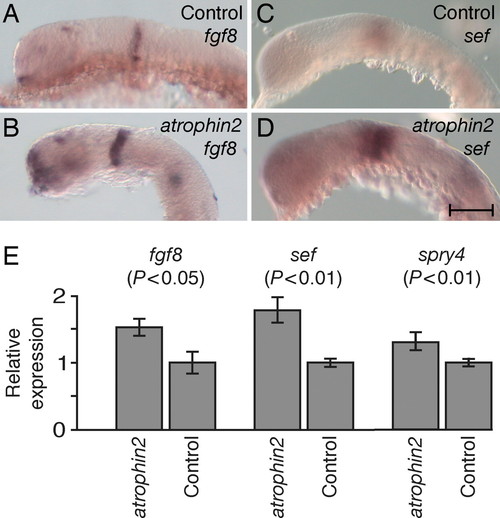
The expression of fgf8 and sef genes in WT and atrophin2 knockdown embryos. (A) In a control embryo at 24 hpf, fgf8 transcripts are detected in the telencephalon, optic stalk, isthmus, otic vesicle, developing somites, and tail bud. (B) fgf8 is expressed more broadly in an atrophin2 knockdown embryo. (C) A 26-somite control embryo treated with sef probe displays prominent labeling of the optic cup and otic vesicle. (D) An atrophin2 knockdown embryo shows a similar pattern of labeling but more extensive expression than in control fish. (E) Quantitative PCR analysis confirms the increased expression of messages for fgf8, sef, and sprouty4 in atrophin2 knockdown animals; significance values were obtained with Student′s one-tailed t test. Control animals were injected with water. The error bars indicate standard deviations. (Scale bar: 100 μm.) EXPRESSION / LABELING:
|