
FIGURE
Fig. 4
- ID
- ZDB-FIG-060718-9
- Publication
- Asai et al., 2006 - Mutation of the atrophin2 gene in the zebrafish disrupts signaling by fibroblast growth factor during development of the inner ear
- Other Figures
- All Figure Page
- Back to All Figure Page
Fig. 4
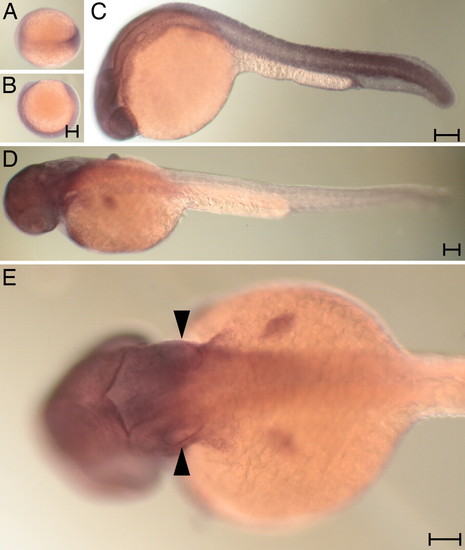
The expression pattern of the atrophin2 gene. Whole-mount in situ hybridization was conducted with a 32 probe at various developmental stages. (A and B) Labeling of the germ band is apparent in a dorsal (A) or a lateral view (B) of the late gastrula. (C) At 24 hpf, essentially all tissue except the yolk is labeled. (D) Labeling diminishes from the caudal extreme by 36 hpf. (E) Arrowheads highlight the labeling of the otic vesicles in a dorsal view of a larva at 36 hpf. (Scale bar: 100 μm.) |
Expression Data
| Gene: | |
|---|---|
| Fish: | |
| Anatomical Terms: | |
| Stage Range: | 90%-epiboly to Prim-25 |
Expression Detail
Antibody Labeling
Phenotype Data
Phenotype Detail
Acknowledgments
This image is the copyrighted work of the attributed author or publisher, and
ZFIN has permission only to display this image to its users.
Additional permissions should be obtained from the applicable author or publisher of the image.
Full text @ Proc. Natl. Acad. Sci. USA