
- Title
-
Hedgehog signalling controls zebrafish neural keel morphogenesis via its level-dependent effects on neurogenesis
- Authors
- Takamiya, M., and Campos-Ortega, J.A.
- Source
- Full text @ Dev. Dyn.
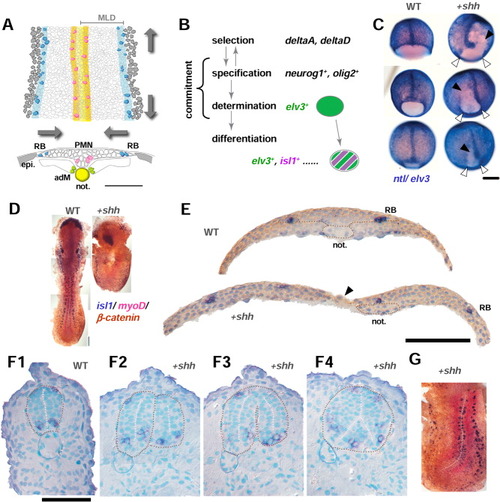
Shh overexpression affects gastrulation and neurulation. A: Medial and lateral proneural columns in the neural keel. Dorsal view (upper) and transverse section (lower) of the developing neuroectoderm to form the neural keel in the future spinal cord region (11.33-14 hpf, 4-10 somite stage). Medial proneural domains (two orange longitudinal columns in the middle of the dorsal view, upper) in which primary motoneurons (pink cells, isl1-positive) are formed, lie intervened by a single row of medial floor plate cells direct dorsal to the axial mesoderm (notochord, yellow) and appear as a medial thickenings in transverse section (lower). Both Shh and Twhh are expressed in the medial floor plate. Adaxial mesodermal cells (adM, yellow green) that give rise to future slow muscle lie adjacent to notochord and express basic helix-loop-helix (bHLH) myogenic factor, myoD, which is under positive control of Hh signalling. Lateral-most proneural columns (blue longitudinal stripes) produce Rohon-Beard sensory neurons (isl1-positive, blue cells) and foxd3-positive premigratory neural crest cells and appear as lateral thickenings in the transverse section (lower). As development progress, cells in the neuroectoderm converge toward the midline (two facing horizontal arrows) and bilateral thickenings fuse with medial structure. Mediolateral extent of the neural keel corresponds to ventrodorsal extent in the neural tube. Normal progress of this morphogenetic process requires at least in part a planar cell polarity gene, trilobite/strabismus. B: Four steps of primary neurogenesis: selection, specification, determination, and differentiation. The term commitment refers to both specification (reversible to selected state) and irreversible determination steps; hence, we call the latter process as the establishment of neuronal commitment as well. elv3 and isl1 mRNA expressions mark the establishment of neuronal commitment (determination) and the onset of differentiation process, respectively. elv3 mRNA expression persists after the onset of isl1 expression within the temporal range of our analyses during the neural keel stage. C: Gastrulae from wild-type (WT, left column) and shh mRNA-injected WT embryos (right column) were fixed at the 75%, 80%, and 90% epiboly stages (top, middle, and bottom, respectively) and overstained with ntl and elv3 to illuminate the deep cells. The animal pole is up, and the vegetal pole is down. Margin of the germ ring proceeds from animal (top) to vegetal (bottom). shh mRNA injection retarded dorsalward convergence movements at the close vicinity of the dorsal midline (black arrowhead), whereas ventral and lateral margin of the germ ring appear to move normally toward the vegetal pole (white arrowhead). Note that, in shh embryos, the notochord is received on one side of the embryo. D: Uninjected control embryos (WT) at the 9-somite stage (left) and shh embryos at the 4- to 5-somite stage (right). Both embryos are obtained from the same crossing and fixed at the same incubation time and processed to isl1(blue)/myoD(red) in situ hybridization followed by overstaining of β-catenin immunohistochemistry (dark brown). shh embryos resemble "trilobite", with short anteroposterior axis and wider mediolateral extent, with a large opening of deep cells covered with a sheet of enveloping layer (EVL). Anteriormost isl1 staining in the hatching gland rudiment (polster) underlies the forebrain in uninjected controls (left); however, in shh embryos, polster was observed underneath the prechordal plate (right). E: The same pair of embryos in D were shown in the transverse sections at the level of the fourth and fifth somite. In shh embryos (lower), two halves of neural anlage did not come to fuse medially, instead, they were tethered with a single layer of EVL (black arrowhead), in good contrast to the uninjected control (upper). Nuclei were counterstained with hematoxylin (blue). F: Transverse sections at the 25-hours postfertilization (hpf) stage of uninjected control embryo (F1) and shh embryos (F2-4). Embryos are stained with isl1 (blue) and counterstained with hematoxylin/truidine blue for nuclei (light blue). F2-4 are all obtained from the same shh embryo and set out from the anterior to posterior direction. The apical and basal surfaces of the neural tube are delineated with white and brown dotted lines, respectively. G: Asymmetric shh mRNA distribution caused curved body axis toward much wider side (affected side), suggesting convergence and concomitant extension movements as an underlying mechanism to shape the neural anlage. In C and D, different focuses of planes are merged for presentation. Orientation in D and G, anterior is up; in E and F, dorsal is up; epi, epidermis; not., notochord; MLD, mediolateral distance. Scale bars = 200 μm in C, 50 μm in E,F. EXPRESSION / LABELING:
|
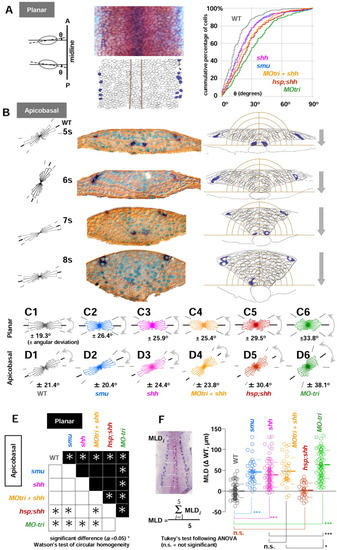
Hh signalling controls elongation polarity of the cells in the neural keel. Embryos fixed between the 4- to 10-somite stages were stained with isl1 (blue)/myoD (red) in situ hybridization followed by β-catenin immunohistochemistry (IHC; overstained in brown). A: Planar cell elongation polarity was analyzed in the dorsal view of the embryos in flat preparation (removed from the yolk cells) at the focal plane that cover the whole neural keel from the medial to the lateralmost regions. An ellipse was fitted to an individual cell, and the angle ({theta}) between each major axis of the cell and the dorsal midline was measured (left and middle panels). The cumulative percentage of cells was calculated in the neural keel as a function of planar cell elongation polarity estimated by {theta} (right panel). MO-tri embryos (green line) are the most affected phenotype, far away from the line for uninjected controls (wild-type [WT], gray line). All the other phenotypes lie between uninjected WT controls and MO-tri embryos: shh (pink line), smu homozygotes (blue), MO-tri/shh embryos (yellow orange), and hsp;shh embryos (brown line). B: Transverse sections of WT embryos (5- to 8-somite stages) are shown in the middle panel. Embryos were stained with isl1 (dark blue)/myoD (red; lost during embedding) followed by β-catenin immunohistochemistry and counterstaining of the nuclei with truidine blue (turquoise). Apicobasal cell polarity analyses were used with both left and right wings of the keel. The right half of the data were flipped horizontally, pooled with the left, and shown in the orientation of the left wing (left). Average orientations of apicobasal axes relative to the midline are 29.7° (5 som), 64.3° (6 som), 21.5° (7 som), and 13.0° (8 som). Examples of freehand outlines used for the analyses are shown on the right panel. The intervals of concentric half-rings centered at the medial floor plate are 10 μm. The neural keel sinks at the rate of 20 μm/ hr. Lateral isl1-RB neurons are found outside of the outermost ring with a radius of 60 μm. C,D: Angular deviation (circular standard deviation) of planar (C) and apicobasal (D) cell elongation polarity. From left to right: WT (gray), smu (blue), shh (pink), MO-tri/shh (yellow orange), hsp;shh (brown), and MO-tri (green). E: Summary of the circular homogeneity test between two groups. Results from planar polarity are shown in the upper half (black) and apicobasal in the lower half (white background). Asterisks are plotted at the intersection of orthogonally arranged pairs of groups, if Watson′s two-sample test for circular homogeneity at the significance level α of 0.05 rejected a null hypothesis that distribution of circular data between two groups are identical. F: Mediolateral distance (MLD) becomes narrower (smaller) as embryos develop. MLD is calculated as a mean length (μm) of five equally spaced measurements on either side of embryos along the anterior-posterior length of the trunk region, as shown in the left photo with five white bars. Measurements of MLDs from various stages during the neural keel stage (11-14 hpf) were collected with WT, smu homozygotes, shh mRNA-injected embryos, MO-tri/shh embryos, hsp;shh embryos and MO-tri embryos. To focus on the MLD-difference from uninjected WT controls, MLD data from each embryo were subtracted with the mean value of uninjected control WT embryos at the identical developmental stage with the same number of somites. Subtracted MLD values ({delta}WT in μm) for each group were pooled and shown as a dot plot with mean (thick line) and standard deviation (SD, thin lines for upper and lower limits) on the direct right. P values from statistical analysis by Tukey′s multiple comparison test after one-way analysis of variance are shown with symbols: ***, P < 0.001; *, P < 0.05; and n.s. (not significant), P > 0.05. Note that MLDs in hsp;shh embryos showed no significant difference from WT embryos, despite their defects in both planar and apicobasal cell elongation polarities. Sample size: wild-type (n = 88); smu (n = 38); shh mRNA (n = 87); MO-tri/shh (n = 34); hsp;shh (n = 30) MO-tri/stbm (n = 76). EXPRESSION / LABELING:
|
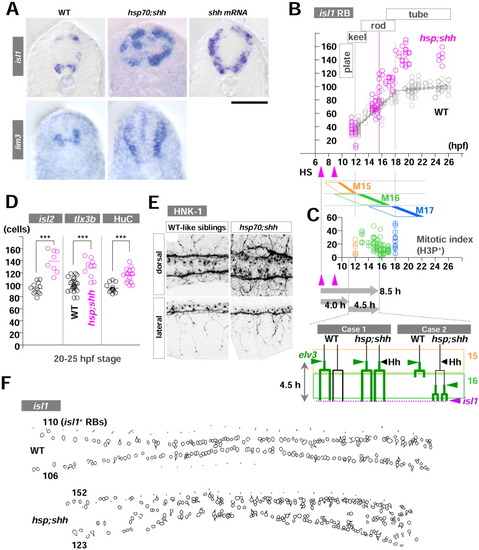
Late hedgehog (Hh) overexpression acts on Rohon-Beard mechanosensory neurons (RB) neurogenesis with a time lag. A: Transverse sections of embryos from the 25-30 hours postfertilization (hpf) stage. Uninjected control wild-type (WT) embryos (left column), hsp;shh embryos (middle), and shh embryos (right) are in situ stained with isl1 (upper row) or lim3 (bottom row). Dorsal is up, and ventral is down. isl1 expression is seen in both dorsal RB neurons and ventral motoneurons (primary and secondary). In contrast, lim3 expression is limited to ventral neurons (both motoneurons and some ventral interneurons). Hh gain-of-function embryos showed dorsal expansion of ventral neuron fates. B: RB neurogenesis can be subdivided into two phases at 18 hpf stage according to the rate of formation. The first and second phases appear to coincide with the 16th and 17th cell division. Two heatshocks (HS) to transactivate the shh gene in hsp;shh embryos resulted in the emergence of supernumerary isl1-RBs no sooner than 15.5 hpf (the 13-somite stage). C: (Upper) Confocal microscopic analyses of mitotic index with phosphorylated histone H3 protein (H3P) show broad waves of mitotic phases due to loose synchronization of the cycles. Each cell cycle ends with the completion of the cell division (M15, M16, and M17; filled region on the right side of each rhomboid). The results were a mixture of different levels of trunk neural anlage along both anteroposterior and ventrodorsal axes. Embryos from 12-18 hpf were pulsed with bromodeoxyuridine (BrdU) then immediately fixed every 30-60 min (total 23 embryos), processed with immunohistochemistry for BrdU and H3P, and H3P-positve/BrdU-negative cells were counted and shown. As to the mitotic index, no significant difference was observed among regions (data not shown, P > 0.05 ANOVA). (Bottom) Models for two possibilities to explain 8.5 hr of time lag between the first pulse of HS and the emergence of supernumerary isl1-RBs. The periods of 15th and 16th cell cycle are shown as rectangular frames. D: RB markers other than isl1 (isl2, tlx3b, and HuC-IHC) confirmed the formation of supernumerary RBs after conditional Shh overexpression. E: HNK-1 immunohistochemistry for WT (left) and hsp;shh (right) embryos to examine morphological features of RB neurons. hsp;shh embryos showed severe defects in fasciculation of dorsal lateral fasciculus (DLF); however, both central and peripheral axons of RB neurons appeared normal. F: Examples of freehand outlines of dorsal view of WT (upper) and hsp;shh embryos (bottom) at the plane of focus for isl1-RBs. Anterior is left, and posterior is to the right. The numbers on the left side indicate the numbers of isl1-RBs on either left or right side of the embryos. Scale bar = 50 μm in A. EXPRESSION / LABELING:
|
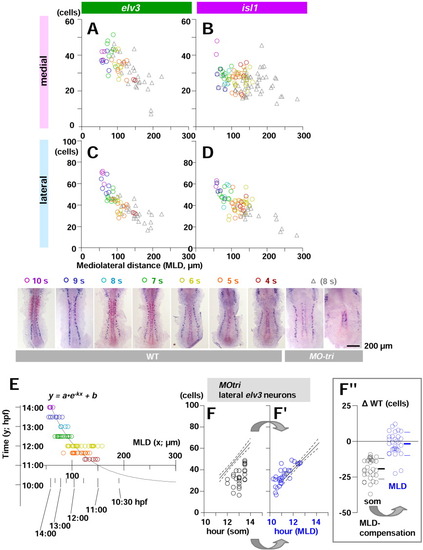
Mediolateral distance (MLD) is a reliable clock for the neural keel. Establishment of neuronal commitment (neuronal determination) is marked by elv3 and the subsequent onset of neuronal differentiation by isl1. A-D: The number of either elv3-positive (left) or isl1-positive (right) cells per side is plotted as a function of MLD of each embryo. Cell count in the medial (upper) and lateral (lower) proneural domains are separately shown. Color codes reflect the absolute developmental age of embryos estimated from the number of somite, as shown at the bottom. As the embryos get older and have more elv3 and isl1 cells, MLD becomes narrower in both medial and lateral proneural domains. Although MO-tri embryos are in the 8-somite stage, the number of neurons is fewer than those normally expected from uninjected controls with the same somite number. Plots from MO-tri embryos (gray triangles) appear to fit well into the regression line toward younger region of uninjected controls. E: A nomograph is presented for MLD compensation that converts MLD values into the time in hours postfertilization (hpf) specific to the development of neuroectoderm during the neural keel stages (4- to 10-somite stages in wild-type [WT]). The X-axis shows average MLD value of each embryos in length (μm), and the Y-axis shows the absolute age of embryos estimated from the number of the somite in time (hpf). We applied a one-phase exponential decay model with a fixed plateau of the curve (b in the formula in E) at 10 hpf as a time of establishment of the neural plate. The span of y (a in the formula in E; time range for neurogenesis) was fixed to 10 hr based on the observation with RB neurogenesis shown in Figure 3B. The best fit value (r2 = 0.6116) was obtained when a rate constant (k in the formula in E) is 0.01553 (n = 88). F,F": In MO-tri embryos, lateral neuronal commitment (elv3 expression) is indistinguishable from WT when scaled in MLD time (F"); in contrast, the case in somite time (F). The regression lines (solid line) with 95% confidence intervals (region in between two dotted lines) are calculated from results with uninjected wild-type and plotted as a reference in both. F": Each cell count data from F and F' was subtracted with the mean calculated from uninjected WT controls at the identical stage estimated by either somite number or MLD, respectively, and expressed as the difference from uninjected controls ({delta}WT). |
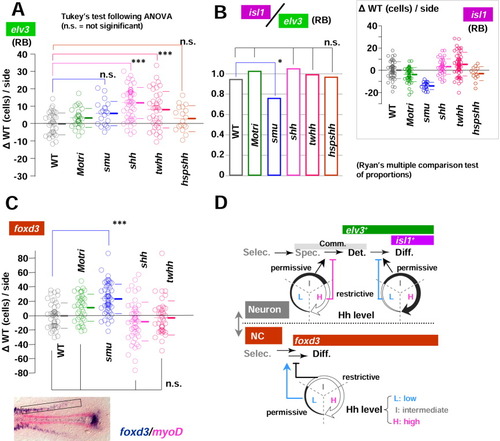
Hedgehog (Hh) level controls Rohon-Beard mechanosensory neurons (RBs) and neural crest formation. A-C: The number of lateral neurons (either elv3-positive [A] or isl1-positive [B inset]) and trunk neural crest [NC] cells [C], foxd3, rectangular domain shown in the photo at the bottom) are counted for groups of embryos (wild-type [WT], MO-tri, smu, shh, twhh, and hsp;shh) and analyzed in mediolateral distance (MLD) time. As in Figure 5, cell count results were expressed as the difference from the uninjected WT controls of the identical MLD stage ({delta}WT, cells/side). P values from statistical analysis by Tukey's multiple comparison test after one-way analysis of variance (A, B inset, and C) are shown with symbols: ***, P < 0.001; **, P < 0.01; *, P < 0.05; and n.s. (not significant) P > 0.05. RB differentiation index (ratio of lateral isl1 cells to lateral elv3 neurons) are calculated from mean values of elv3 and isl1 cells and shown as a bar chart. For application of Ryan's multiple comparison test of proportions, calculated ratios were rounded to the nearest integer, and P values at the significant level of 0.05 are shown with symbols: *, P < 0.05; n.s. (not significant) P > 0.05. Note that the loss-of-function Hh mutant smu showed a decreased RB differentiation index, demonstrating the requirement of Hh signalling in the lateral proneural domains. C: The loss-of-function Hh mutant smu showed significantly increased numbers of foxd3-positive trunk neural crest cells (***, P < 0.001 in Tukey's test after one-way analysis of variance). D: Models of Hh function on lateral neurogenesis and neural crest formation. Hh signalling adds fine adjustment on the established neural fates (neuron vs neural crest). Selec, selection; Spec, specification; Det, determination (the establishment of commitment); Diff, differentiation (onset of differentiation). EXPRESSION / LABELING:
|
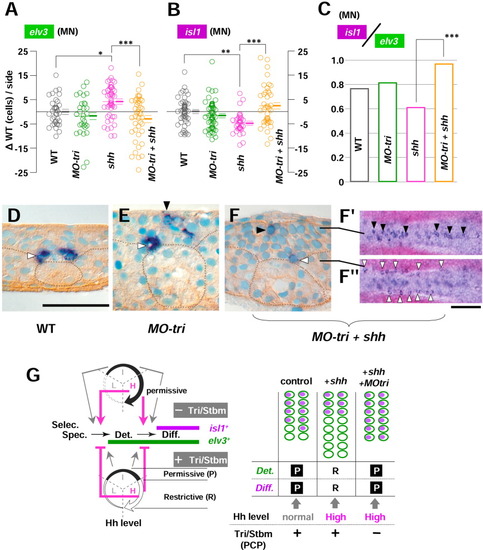
Medial Tri/Stbm mediated planar cell polarity (PCP) pathway reverses hedgehog (Hh) function on the medial neurogenesis into opposite in a polarity-independent manner. A-C: The number of neurons (either elv3-positive or isl1-positive) are counted during the neural keel stage (4- to 10-somite stages) and analyzed in mediolateral distance (MLD) time. As in Figures 5 and 6, results are shown as the difference from the uninjected controls of the identical MLD stages ({delta}WT [wild-type], cells/side) and pooled for each group of embryos of WT, MO-tri, shh mRNA-injected, and MO-tri/shh embryos. P values from statistical analysis by Tukey′s multiple comparison test after one-way analysis of variance (A,B) are shown with symbols: ***, P < 0.001; **, P < 0.01; and *, P < 0.05. Note that in shh mRNA-injected embryos, the increase from uninjected controls for elv3 (A, *P < 0.05) and decrease in isl1 cells (B, **P < 0.01) turned into the opposite upon co-injection with MO-tri, which are clearly reflected in motoneuron (MN) differentiation index (ratio of isl1 medial cells to elv3 medial neurons, C). D-F: Ectopic medial neurons are repressed by Tri/Stbm-mediated PCP pathway in a polarity-independent manner. D: In uninjected controls, medial isl1-PMNs are found (white arrowhead) at the bottom (basal side) of the neural keel intervened by floor plate cells adjacent to the notochord (dotted circle) and usually never seen at the apical side. E: However, in MO-tri embryos, ectopic isl1-medial neurons (black arrowhead) are found at the apical surface, together with the normal PMN at the basal position (white arrowhead). F,F′: This effect seems to be by means of a polarity-independent pathway, because ectopic medial neurons were not suppressed (black arrowhead; dorsal views at the focal plane of the line) in embryos with disturbed cell polarity (MO-tri/shh embryos) to a level comparable to shh embryos with no ectopic medial neurons. G: (Left) Medial Tri/Stbm-mediated PCP pathway reverses the function of a high Hh level at the two steps of medial neurogenesis: the establishment of commitment (at the transition from specification to determination) and the onset of neuronal differentiation (at the transition from determination to differentiation). As to the function of a low Hh level, analysis is pending (indicated by dotted line). (Right) Schematic drawings to present how reversed Hh function upon reduced Tri/Stbm-mediated PCP pathway caused supernumerary medial isl1 neurons. elv3 expression is shown as blank green ellipses and isl1 expression as violet-filled ellipses. P, permissive; R, restrictive. Scale bars = 50 μm for D-F, 100 μm for F. EXPRESSION / LABELING:
|