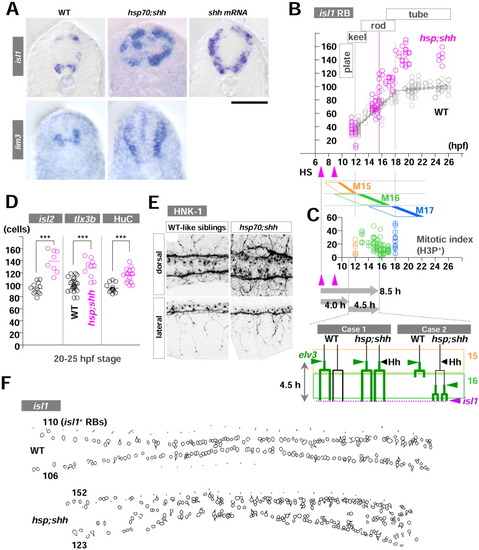
Late hedgehog (Hh) overexpression acts on Rohon-Beard mechanosensory neurons (RB) neurogenesis with a time lag. A: Transverse sections of embryos from the 25-30 hours postfertilization (hpf) stage. Uninjected control wild-type (WT) embryos (left column), hsp;shh embryos (middle), and shh embryos (right) are in situ stained with isl1 (upper row) or lim3 (bottom row). Dorsal is up, and ventral is down. isl1 expression is seen in both dorsal RB neurons and ventral motoneurons (primary and secondary). In contrast, lim3 expression is limited to ventral neurons (both motoneurons and some ventral interneurons). Hh gain-of-function embryos showed dorsal expansion of ventral neuron fates. B: RB neurogenesis can be subdivided into two phases at 18 hpf stage according to the rate of formation. The first and second phases appear to coincide with the 16th and 17th cell division. Two heatshocks (HS) to transactivate the shh gene in hsp;shh embryos resulted in the emergence of supernumerary isl1-RBs no sooner than 15.5 hpf (the 13-somite stage). C: (Upper) Confocal microscopic analyses of mitotic index with phosphorylated histone H3 protein (H3P) show broad waves of mitotic phases due to loose synchronization of the cycles. Each cell cycle ends with the completion of the cell division (M15, M16, and M17; filled region on the right side of each rhomboid). The results were a mixture of different levels of trunk neural anlage along both anteroposterior and ventrodorsal axes. Embryos from 12-18 hpf were pulsed with bromodeoxyuridine (BrdU) then immediately fixed every 30-60 min (total 23 embryos), processed with immunohistochemistry for BrdU and H3P, and H3P-positve/BrdU-negative cells were counted and shown. As to the mitotic index, no significant difference was observed among regions (data not shown, P > 0.05 ANOVA). (Bottom) Models for two possibilities to explain 8.5 hr of time lag between the first pulse of HS and the emergence of supernumerary isl1-RBs. The periods of 15th and 16th cell cycle are shown as rectangular frames. D: RB markers other than isl1 (isl2, tlx3b, and HuC-IHC) confirmed the formation of supernumerary RBs after conditional Shh overexpression. E: HNK-1 immunohistochemistry for WT (left) and hsp;shh (right) embryos to examine morphological features of RB neurons. hsp;shh embryos showed severe defects in fasciculation of dorsal lateral fasciculus (DLF); however, both central and peripheral axons of RB neurons appeared normal. F: Examples of freehand outlines of dorsal view of WT (upper) and hsp;shh embryos (bottom) at the plane of focus for isl1-RBs. Anterior is left, and posterior is to the right. The numbers on the left side indicate the numbers of isl1-RBs on either left or right side of the embryos. Scale bar = 50 μm in A.
|
