
- Title
-
Cloning and embryonic expression of zebrafish PLAG genes
- Authors
- Pendeville, H., Peers, B., Kas, K., and Voz, M.L.
- Source
- Full text @ Gene Expr. Patterns
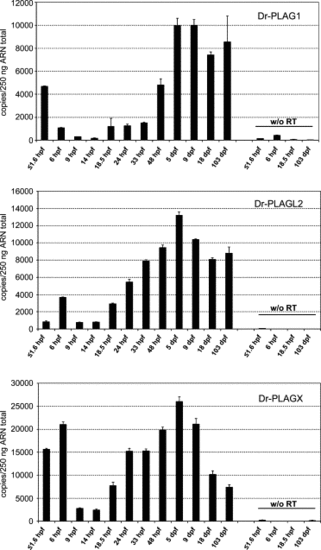
Time course analysis of zebrafish PLAG expression by quantitative real-time RT-PCR. Quantitative results are presented as normalized mean (±SD) copies of target genes per 250 ng RNA. Each sample was run in triplicate, together with known dilutions of respective plasmid cDNA ranging from 105 to 101 copies, the appropriate non-template controls and mock reverse-transcribed RNA (samples noted w/o RT). For PLAGX real-time PCR runs, melting curve analyses were performed and single specific melting peaks were observed indicating amplification specificity. The absence of cross-reactivity between the different PLAG members was also checked. The normalization factor was calculated using the copy number of 18S in the cDNA sample versus the average 18S copy number in all 12 cDNAs samples. The temporal expression profiles of the PLAG genes were also confirmed using a second set of reverse-transcribed RNAs isolated independently (data not shown). |
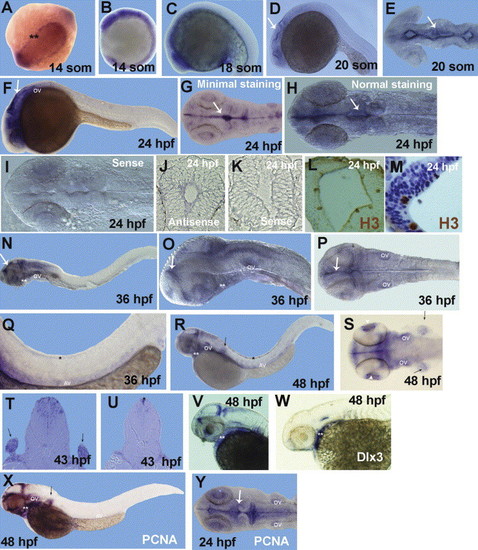
Spatio-temporal distribution of the zebrafish PLAGL2 transcripts from 14 somite stage to 48 hpf and comparison with the proliferative marker PCNA. Whole mount in situ hybridization was performed using either PLAGL2, PCNA or Dlx3 antisense probes (except in L,M whole mount immunohistochemistry with anti-phosphohistone H3 antibody). The developmental stage is indicated in each panel. (A) Posterior view of a 14 somite stage embryo. Lateral (B,C,D,F,N,O,Q,R,V,W,X) or dorsal (E,G,H,I,P,S,Y) views of zebrafish embryos with anterior to the left. Transverse sections (5 μm) at the level of the midbrain in J,K,L,M, hindbrain in T or at the trunk level in U. (A,B) At 14 somite stage, PLAGL2 is expressed ubiquitously at low levels and more strongly in the lateral plate mesoderm and in the developing brain and eyes. (C) At 18 somite stage, staining is seen throughout the whole embryo and more intensely in the developing brain and the lateral mesoderm. (D,E) At 20 somite stage, PLAGL2 expression is evident in the anteriomost part of the embryos and more specifically in the ventricular zone. (F,G,H) Staining is evident in the brain, the otic vesicles and the eyes at 24 hpf. (J) A microtome section confirms the preferential expression of PLAGL2 in the apical region of the ventricular zone of the brain. (L) These PLAGL2-labelled cells correspond to a proliferative zone as shown by the high number of mitotically active cells (stained by anti-phospho H3 antibody) at the ventricular border (brown spots in L). (M) H&E-stained section showing the highly cytoplasmic content of the cells lining the brain ventricle. Expression of PLAGL2 at 36 and 48 hpf is evident in the brain ventricles (N,O,P,R), the ganglion cell layer of the retina (S), the pharyngeal region (double white asterisks in O,R,V), the otic vesicles and the roof of the neural tube (black asterisk in Q,R,U). A signal is also observed in the developing fin buds (black arrows in R,S,T) and the developing vasculature at 36 and 48 hpf (Q,R). (W) Expression of Dlx3 in pharyngeal arch primordia, similar to that observed for PLAGL2 at 48 hpf (V). (Q, R) Views of 24 and 48 hpf embryos stained with PCNA antisense probe. Note the striking similarity of the signal observed between PCNA and PLAGL2 at the same stage (compare R and X, G and Y). Double black asterisks indicate the lateral plate mesoderm. White arrows denote the ventricular surface of the brain. Black arrows show the pectoral fin buds. Black asterisk indicates the top of the neural tube. White arrowhead points to the ganglion cell layer of the retina. Double white asterisks denote the developing pharyngeal arches. OV, otic vesicles; AV, axial vasculature. EXPRESSION / LABELING:
|
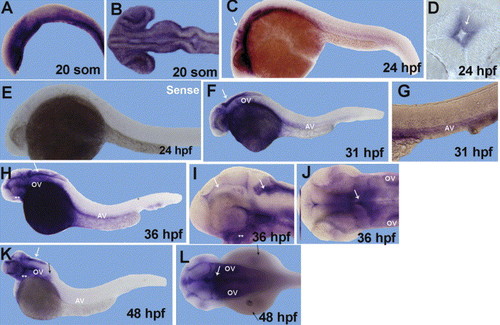
Spatio-temporal distribution of the zebrafish PLAG1 transcripts from 20 somite stage to 48 hpf. Embryos (A,C,E,F,G,H,I,K) are shown in lateral view, with anterior to the left. Embryos (B,J,L) are shown in dorsal view with anterior to the left. (D) is a vibratome section at the midbrain level. (A,B) Wide expression of PLAG1 transcript throughout the whole embryo at 20 s stage. (C,F) At 24 and 31 hpf, PLAG1 expression is located in the brain ventricles (as shown on a vibratome section at 24 hpf in D), the otic vesicles, the eyes and the developing axial vasculature. (G) Magnified view of the trunk at 31 hpf showing a high staining in the vasculature. The brain, developing fin buds and primordia of the pharyngeal arches are also highly stained at 36 hpf (H,I) and 48 hpf (K,L). (I,J,L) Magnified views showing that PLAG1 signal is mostly located in the brain ventricles (more intensely in the hindbrain ventricle), the neurocranium and the pectoral fin buds. The lens appears also weakly stained at these stages. White arrows denote the ventricular zone of the brain. Black arrows show the pectoral fin buds. Double white asterisks indicate the developing pharyngeal arches. OV, otic vesicles; AV, axial vasculature. EXPRESSION / LABELING:
|
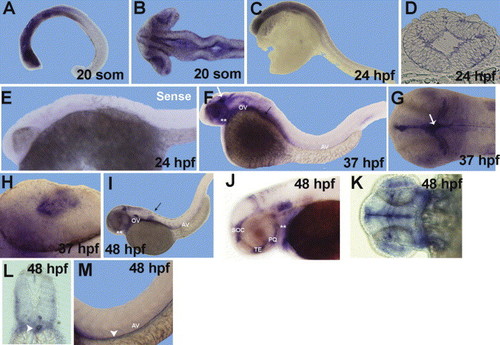
Spatio-temporal distribution of the zebrafish PLAGX transcripts from 20 somite stage to 48 hpf. (A,C,E,F,I,J,M) Lateral views, anterior to the left. (B,G,H,K) Dorsal views, anterior to the left. (D) Microtome section at the midbrain level. (L) Vibratome section at the trunk level. (A,B) PLAGX is ubiquitously expressed in the anteriormost part of the embryo at 20 somite stage. (C) The expression remains high and wide in the brain at 24 hpf, as shown by the intensity of the signal detected through a 5 μm section (D). At 37 hpf (F,G) and 48 hpf (I,J,K), PLAGX is detected in the brain, eyes, neurocranium, otic vesicles, developing arches, pectoral fin buds and axial vasculature. (H) The whole lens appears labelled at 37 and 48 hpf. A specific signal is also observed in the gut at 48 hpf as clearly detected on the vibratome section shown in L and in the lateral view of the tail represented in M. White arrows denote the ventricular surface of the brain. Black arrows show the pectoral fin buds. Double white asterisks indicate the developing pharyngeal arches. White arrowhead shows the gut at 48 hpf. OV, otic vesicles; AV, axial vasculature; PQ, palatoquadrate of the pharyngeal arches; TE, trabeculea of the neurocranium; SOC, superoptic cartilage. EXPRESSION / LABELING:
|
Reprinted from Gene expression patterns : GEP, 6(3), Pendeville, H., Peers, B., Kas, K., and Voz, M.L., Cloning and embryonic expression of zebrafish PLAG genes, 267-276, Copyright (2006) with permission from Elsevier. Full text @ Gene Expr. Patterns