
|
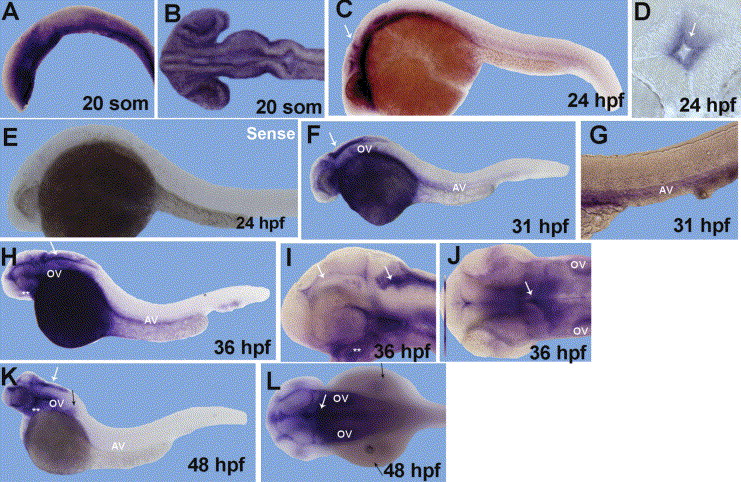
Fig. 5 Spatio-temporal distribution of the zebrafish PLAG1 transcripts from 20 somite stage to 48 hpf. Embryos (A,C,E,F,G,H,I,K) are shown in lateral view, with anterior to the left. Embryos (B,J,L) are shown in dorsal view with anterior to the left. (D) is a vibratome section at the midbrain level. (A,B) Wide expression of PLAG1 transcript throughout the whole embryo at 20 s stage. (C,F) At 24 and 31 hpf, PLAG1 expression is located in the brain ventricles (as shown on a vibratome section at 24 hpf in D), the otic vesicles, the eyes and the developing axial vasculature. (G) Magnified view of the trunk at 31 hpf showing a high staining in the vasculature. The brain, developing fin buds and primordia of the pharyngeal arches are also highly stained at 36 hpf (H,I) and 48 hpf (K,L). (I,J,L) Magnified views showing that PLAG1 signal is mostly located in the brain ventricles (more intensely in the hindbrain ventricle), the neurocranium and the pectoral fin buds. The lens appears also weakly stained at these stages. White arrows denote the ventricular zone of the brain. Black arrows show the pectoral fin buds. Double white asterisks indicate the developing pharyngeal arches. OV, otic vesicles; AV, axial vasculature.
Reprinted from Gene expression patterns : GEP, 6(3), Pendeville, H., Peers, B., Kas, K., and Voz, M.L., Cloning and embryonic expression of zebrafish PLAG genes, 267-276, Copyright (2006) with permission from Elsevier. Full text @ Gene Expr. Patterns