
|
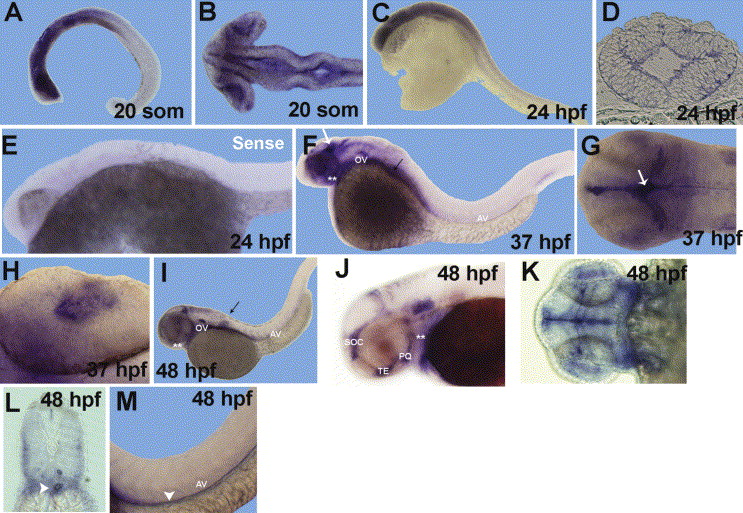
Fig. 6 Spatio-temporal distribution of the zebrafish PLAGX transcripts from 20 somite stage to 48 hpf. (A,C,E,F,I,J,M) Lateral views, anterior to the left. (B,G,H,K) Dorsal views, anterior to the left. (D) Microtome section at the midbrain level. (L) Vibratome section at the trunk level. (A,B) PLAGX is ubiquitously expressed in the anteriormost part of the embryo at 20 somite stage. (C) The expression remains high and wide in the brain at 24 hpf, as shown by the intensity of the signal detected through a 5 μm section (D). At 37 hpf (F,G) and 48 hpf (I,J,K), PLAGX is detected in the brain, eyes, neurocranium, otic vesicles, developing arches, pectoral fin buds and axial vasculature. (H) The whole lens appears labelled at 37 and 48 hpf. A specific signal is also observed in the gut at 48 hpf as clearly detected on the vibratome section shown in L and in the lateral view of the tail represented in M. White arrows denote the ventricular surface of the brain. Black arrows show the pectoral fin buds. Double white asterisks indicate the developing pharyngeal arches. White arrowhead shows the gut at 48 hpf. OV, otic vesicles; AV, axial vasculature; PQ, palatoquadrate of the pharyngeal arches; TE, trabeculea of the neurocranium; SOC, superoptic cartilage.
Reprinted from Gene expression patterns : GEP, 6(3), Pendeville, H., Peers, B., Kas, K., and Voz, M.L., Cloning and embryonic expression of zebrafish PLAG genes, 267-276, Copyright (2006) with permission from Elsevier. Full text @ Gene Expr. Patterns