
- Title
-
AP2-dependent signals from the ectoderm regulate craniofacial development in the zebrafish embryo
- Authors
- Knight, R.D., Javidan, Y., Zhang, T., Nelson, S., and Schilling, T.F.
- Source
- Full text @ Development
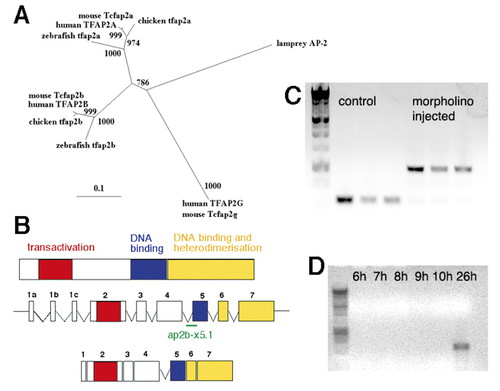
Cloning and characterization of a zebrafish tfap2b. (A) Phylogenetic tree of AP2 genes shows zebrafish tfap2b more closely related to other vertebrate AP2b genes than to other zebrafish AP2 genes. Putative protein sequences of AP2 genes were aligned using ClustalX, edited by eye and used to generate a maximum likelihood tree by quartet puzzling using the PUZZLE program. Values at the nodes are likelihood values, showing support for that node out of 1000; branch lengths represent sequence divergence. (B) tfap2b contains the highly conserved transactivation (red), DNA-binding (blue) and heterodimerization domains (yellow) found in all AP2 proteins. Exon-intron boundaries are identical in tfap2a and tfap2b, and both have three alternative first exons (1a-c). A morpholino oligonucleotide directed against the splice acceptor site before exon 5 (ap2b-x5.1-′ap2bMO′) should create a larger, unspliced product. (C) Splicing defects in tfap2b transcripts following ap2bMO injection. tfap2b was amplified from pools of ap2bMO-injected and control uninjected animals at 24 hpf using primers tfap2bf and tfap2br directed to exons 4 and 6, respectively. Uninjected animals showed PCR products of |
 210 bp in size in comparison with ap2bMO-injected animals in which one larger product (
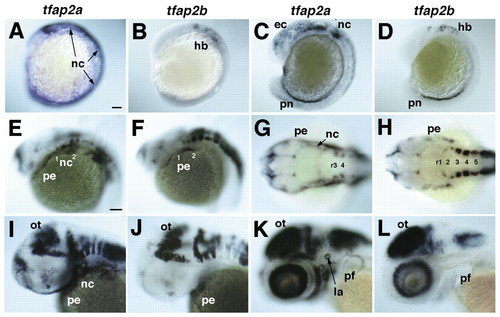
Expression of tfap2a and tfap2b in early zebrafish embryos. Whole-mount in situ hybridization was performed with antisense RNA probes. Anterior is towards the left. (A,B) Lateral views at eight somites. (A) Expression of tfap2a in neural crest (nc) and non-neural ectoderm. (B) Hindbrain (hb) expression of tfap2b. (C,D) Lateral views, 18 somites. (C) tfap2a expression in migrating cranial NCCs, non-neural ectoderm (ec) and pronephric duct (pn). (D) tfap2b expression in the hindbrain and co-expression with tfap2a in the pronephric duct. (E,F) Lateral views of the head at 24 hpf showing co-expression of tfap2a and tfap2b in the forebrain, and in segmental cell groups in the hindbrain. (E) tfap2a expression in the pharyngeal NCCs (nc) and ectoderm (pe). (F) tfap2b expression in the ectoderm of arches 1 and 2. (G,H) Dorsal views, 24 hpf. (G) tfap2a expression in the CNS, including rhombomeres (r3 and r4) and in pharyngeal NCCs and ectoderm. (H) tfap2b expression in rhombomeres of the hindbrain and in pharyngeal ectoderm, but not in NCCs. (I,J) Lateral views, 36 hpf. tfap2a and tfap2b co-expression in the optic tectum (ot) and tegmentum of the midbrain and hindbrain, and in the pharyngeal ectoderm. Only tfap2a is expressed in NCCs. (K,L) Lateral views, 52 hpf. tfap2a and tfap2b co-expression in the midbrain and hindbrain, and in the ganglion cell layer of the retina. Only tfap2a is expressed in the pharyngeal arches, lateral line organs (la) and in the apical ectoderm of the pectoral fins (pf). Scale bars: in A, 100 µm for A-D; in E, 100 µm for E-L.
EXPRESSION / LABELING:
|
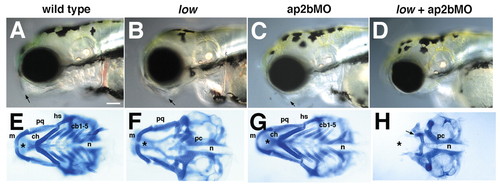
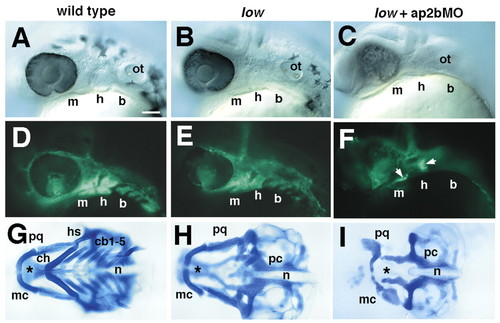
Jaw and pharyngeal cartilage defects in low mutants and in larvae injected with ap2bMO. Lateral views (A-D) of live larvae show reduced head size and jaw defects (arrows) in AP2-deficient animals at 4 dpf. (E-H) Dissected pharyngeal cartilages from 4 dpf shown in ventral view. Pharyngeal cartilages are absent or reduced in all but the mandibular arch in low mutants (F), and fuse with the anterior basicranial commissure of the skull. The neurocranium (asterisks) is typically not affected. (G) Injection of ap2bMO alone has no effect, but injection into low (H) causes loss of both pharyngeal and neurocranial cartilage. The posterior neurocranium remains intact. cb, ceratobranchial; ch, ceratohyal; hs, hyosymplectic; m, Meckel′s cartilage; n, notochord; pc, parachordals; pq, palatoquadrate. Scale bars: 100 µm. |
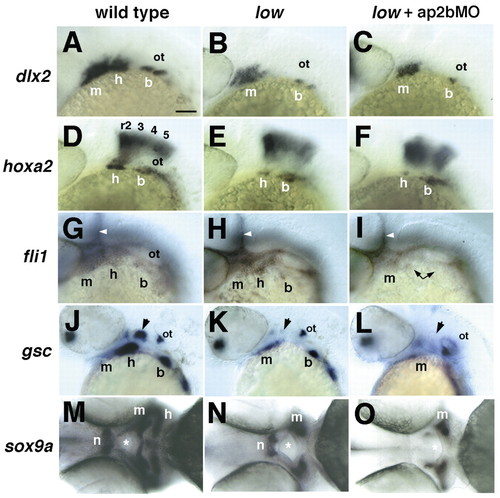
Defects in pharyngeal arch development in low mutants and in larvae injected with ap2bMO. Whole-mount in situ hybridization with riboprobes to dlx2 (A-C; 28 hpf), hoxa2 (D-F; 28 hpf), fli1 (G-I; 28 hpf), gsc (J-L; 40 hpf) and sox9a (M-O; 52 hpf). (A-L) All embryos are shown in lateral view, except M-O, which are ventral views. Wild-type (A,D,G,J,M), low (B,E,H,K,N) and injected low mutants (C,F,I,L,O). Arrowheads in G-I indicate vascular expression of fli1. Arrows in J-L indicate the hyosymplectic condensation in the dorsal second arch. Asterisks in M-O indicate the mouth. All five NCC markers are reduced in the second pharyngeal arch in low mutants, but only fli1, gsc and sox9a defects are enhanced by Tfap2b depletion (L,P,T). b, branchial arches; h, hyoid arch; hb, hindbrain; m, mandibular arch; n, notochord. Scale bars: 100 µm. |
Cartilage defects correlate with postmigratory NCC defects in low mutants and larvae injected with ap2bMO. Columns consist of photos taken at different stages in the same animal. Lateral views of living fli1-GFP transgenic embryos at 28 hpf (A-F) and cartilage preparations from the same individuals at 4 dpf (G-I). fli1-GFP expression includes both NCC as well as developing endothelial cells. Arrows in F indicate residual NCCs. b, branchial arches; cb, ceratobranchial; ch, ceratohyal; h, hyoid arch; hs, hyosymplectic; m, mandibular arch; mc, Meckels cartilage; n, notochord; pc, parachordals; pq, palatoquadrate. Scale bars: 100 µm. |
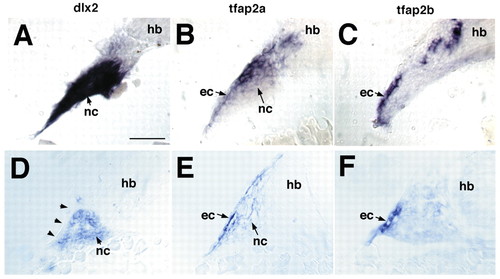
tfap2a and tfap2b are co-expressed in the ectoderm, but only tfap2a is expressed in pharyngeal arch NCCs. Transverse cryosections through the pharyngeal region of embryos at 26 hpf (A-C) and 36 hpf (D-F) labeled by in situ hybridization with riboprobes to dlx2 (A,D), tfap2a (B,E) and tfap2b (C,F). Left side views, with the pharyngeal lumen, neural tube and notochord at the midline lying to the right. Arrowheads in D indicate unlabeled surface ectoderm. Scale bars: 50 µm. |
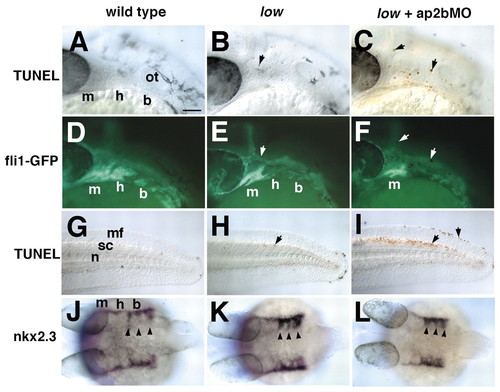
Defects in ectodermal specification and survival in low mutants and in larvae injected with ap2bMO. (A-I) TUNEL labeling of apoptotic cells at 28 hpf is shown in lateral views of the head (A-F) and tail (G-I). (D-F) Co-labeling with TUNEL and the fli1-GFP transgene showing apoptosis lateral to the NCCs in the surface ectoderm (arrows). (J-L) In situ hybridization for nkx2.3 at 28 hpf in dorsal view. Expression is detected in pharyngeal ectoderm and endodermal pouches (arrowheads). b, branchial; h, hyoid; m, mandibular; mf, median fin; n, notochord; ot, otic vesicle; sc, spinal cord. Scale bars: 100 µm. EXPRESSION / LABELING:
|
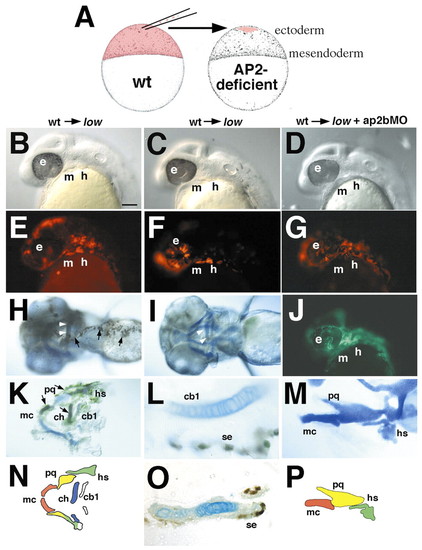
Transplants suggest that tfap2a and tfap2b are required in the pharyngeal ectoderm, and act non-autonomously in NCCs. Each column represents photos taken at different stages of the same animal. Columns 1 and 2 show transplants from wild-type donors into low mutant hosts, whereas the host in column 3 is a low mutant injected with ap2bMO. Prospective cranial ectodermal cells were transplanted from donor embryos labeled with a lineage tracer into unlabeled hosts at 4-5 hpf (A). Lateral views of living mosaic embryos at 28 hpf (A-G) showing that transplanted cells (red rhodamine-labeled cells in E-G) form patches of ectoderm covering parts of the face and arches. (H,I) Ventral views of mosaic larvae at 4 dpf stained for biotinylated lineage tracer (brown) in the ectoderm. Arrows in H indicate transplanted donor cells in ectoderm. Arrowheads in H,I indicate rescued cartilage of the ceratohyal. (J) fli1-GFP expression in the same embryo as G. (K,M) Flat-mounted rescued cartilages (blue) with ectoderm attached (brown). (L) Higher magnification view of the larvae shown in I, in which transplanted ectodermal cells and cartilage can be clearly distinguished. (O) Section through rescued ceratohyal cartilage in K. (N,P) Diagrams of cartilages shown in K and M. cb, ceratobranchial; ch, ceratohyal; e, ethmoid; h, hyoid arch; hs, hyosymplectic; m, mandibular arch; mc, Meckel's cartilage; ot, otic vesicle; pc, parachordals; pq, palatoquadrate; se, surface ectoderm; t, trabeculae. Scale bars: 50 µm. |
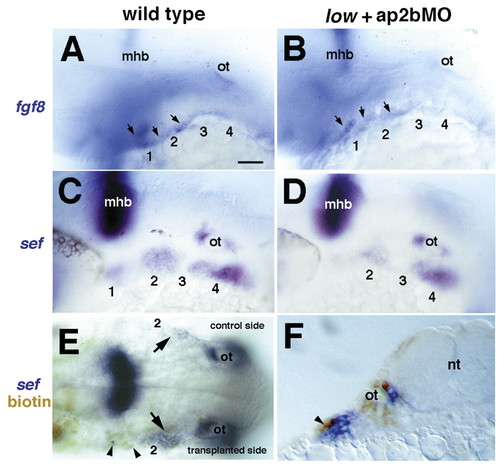
tfap2a and tfap2b are required for Fgf signaling in NCCs. Lateral views, anterior towards the left. (A,B) At 32 hpf, fgf8 mRNA is detected in wild type in the ectoderm covering the arches, in addition to the mid-hindbrain boundary (mhb); this expression remains in AP2a/b-deficient embryos. Arrows in A,B indicate ectodermal expression of fgf8. (C,D) At 28 hpf in wild type, sef mRNA is detected in NCCs; this expression is severely reduced in AP2a/b-deficient embryos. (E,F) Mosaic embryos in which biotin-labeled, wild-type ectodermal cells (brown, arrows) were transplanted on one side of the head and partially restore sef expression (blue). (E) Dorsal view, anterior towards the left showing transplanted side with substantially increased levels of sef expression, and lack of expression on the contralateral, control side (arrows). (F) A transverse section through the embryo shown in E at the level of the hyoid arch showing grafted wild-type ectoderm (brown) and rescued sef expression in underlying NC (blue). Arrowhead in F indicates transplanted ectoderm. m, mandibular arch; h, hyoid arch; b, branchial arches. Scale bars: 50 µm. |