
- Title
-
Shield formation at the onset of zebrafish gastrulation
- Authors
- Montero, J.A., Carvalho, L., Wilsch-Bräuninger, M., Kilian, B., Mustafa, C., and Heisenberg, C.P.
- Source
- Full text @ Development
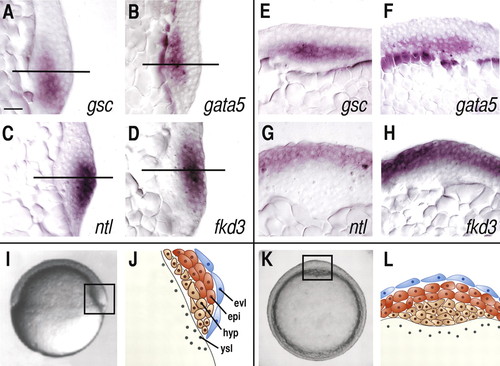
Expression patterns of marker genes for (neuro)ectodermal, mesodermal and endodermal progenitor cells within the shield region at the onset of gastrulation (60% epiboly). Sagittal (A-D) and frontal (E-H) sections of the shield region demarcating the expression domains of goosecoid (gsc; A,E), gata5 (B,F), notail (ntl; C,G) and forkhead3 (fkd3; D,H). The horizontal lines in A-D indicate the level where the frontal sections in E-H were taken. (I-L) Orientation of the embryos (I,K) and schematic representations (J,L) of the shield region (boxed areas in I,K), representing sagittal (I,J) and frontal (K,L) views of the shield as shown in panels A-D and E-H, respectively. Please note that number of cell layers depicted in the schematic diagrams is lower than in the real embryo (for details about cell layer numbers, see Results). epi, epiblast; hyp, hypoblast; evl, enveloping cell layer; ysl, yolk syncytial layer. Scale bar in A: 100 µm for A-H. EXPRESSION / LABELING:
|
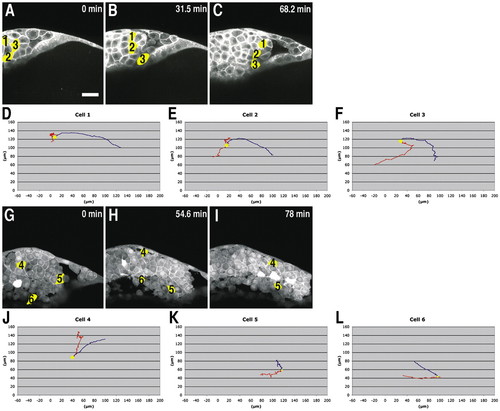
Movement tracks of exemplary cells within the shield region during early stages of gastrulation. (A-C) Lateral (sagittal) views of the forming shield at 40% epiboly±0 minutes (A), +31.5 minutes (B) and +68.2 minutes (C). (D-F) Tracks of the three exemplary cells marked yellow in A-C. (G-I) Lateral (sagittal) views of the shield at 60% epiboly±0 minutes (G), +54.6 minutes (H) and +78 minutes (I). (J-L) Movement tracks of the three exemplary cells marked yellow in G-I. The cells were tracked in 2.6-minute time intervals for a total period of 68 (cells 1-3), 81 (cell 4), 66 (cell 5) and 60 (cell 6; note that this cell has already left the frame in I) minutes. For each exemplary cell, at least 10 other cells at similar positions within the germ ring from at least three independent movies were tracked. The blue tracks in D-F and J-L delineate the movement within the embryo, while the red tracks show the movement of the respective cell within the germ ring (for details see Materials and methods and Fig. S1 in supplementary material). The yellow dots (D-F,J-L) indicate the starting points of the cell tracks. Scale bar in A: 30 µm. |
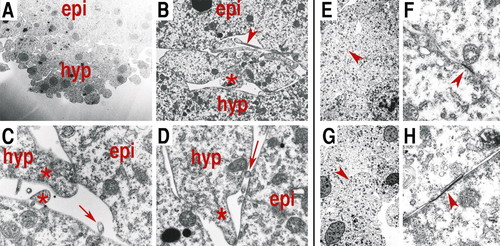
Electron microscopy (EM) images of the border region between epiblast (ectoderm) and hypoblast (mesendoderm) at the onset of gastrulation (65% epiboly). (A) Frontal section of the shield region showing the apposition of epiblast and hypoblast tissues. (B) Multiple cellular processes crossing the border between epiblast and hypoblast. (C,D) Hypoblast cell process directly contacting an adjacent epiblast cell. (E-H) Structures resembling tight junctions between two epiblast (E,F) and hypoblast (G,H) cells at low (E,G) and high magnifications (F,H). Asterisks in B-D indicate cellular processes resembling pseudopods, arrowheads indicate structures resembling lamellipods and arrows indicate processes looking similar to filopods. Arrowheads in E,G point at the places within the epiblast and hypoblast, respectively, where the tight junctions shown in F,H were found. epi, epiblast; hyp, hypoblast. |
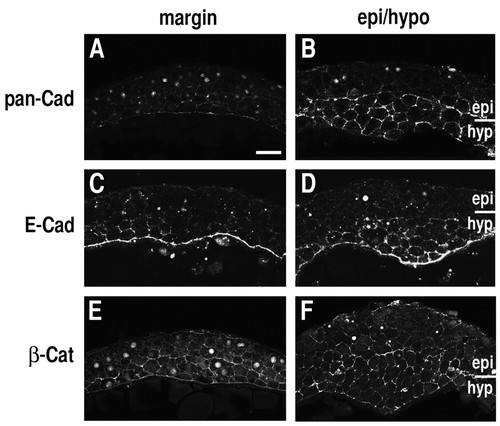
Localization of pan-Cadherin, E-Cadherin and ß-Catenin in epiblast (ectoderm) and hypoblast (mesendoderm) cells within the shield at the onset of gastrulation (65% epiboly). Frontal sections of the shield region at the margin (A,C,E) and four to six cell diameters away from the margin (B,D,F) stained with an anti-pan-Cadherin (A,B), anti-E-Cadherin (C,D) and anti-ß-Catenin (E,F) antibody. epi, epiblast; hyp, hypoblast. Scale bar in A: 40 µm. |
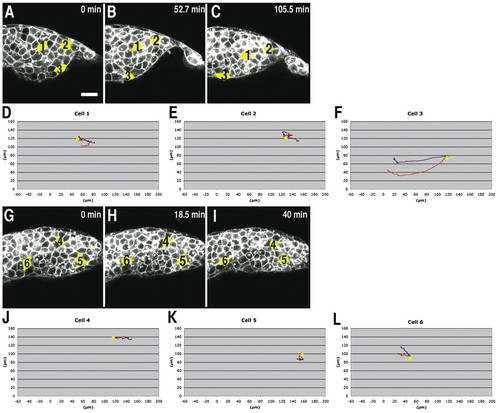
Movement tracks of exemplary cells within the shield region of e-cadherin morphant embryos during early stages of gastrulation. (A-C) Lateral (sagittal) views of the shield at 6 hpf±0 minutes (A), +52.7 minutes (B) and +105.5 minutes (C). (D-F) Tracks of the three exemplary cells marked yellow in A-C. (G-I) Lateral (sagittal) views of the shield at 7.5 hpf±0 minutes (G), +18.5 minutes (H) and +40 minutes (C). (J-L) Tracks of the three exemplary cells marked yellow in G-I. The cells were tracked in 2.6-minute time intervals for a total period of 105 (cells 1-3) and 63 minutes (cells 4-6). For each exemplary cell, at least 10 other cells at similar positions within the germ ring from at least three independent movies were tracked. The blue tracks in D-F and J-L delineate the movement within the embryo, while the red tracks show the movement of the respective cell within the germ ring (for details see Materials and methods and Fig. S1 in supplementary material). The yellow dots in D-F,J-L indicate the starting points of the cell tracks. Scale bar in A: 30 µm. |
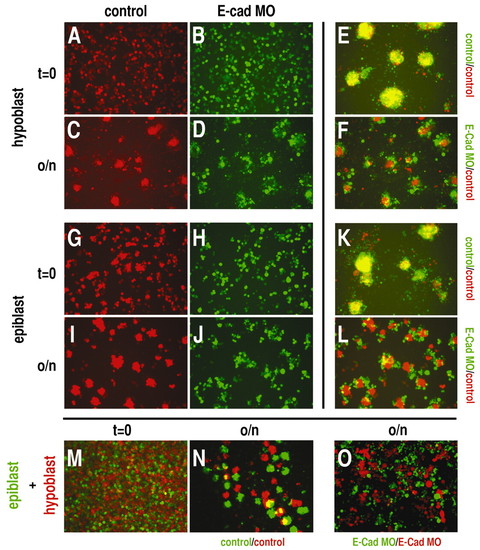
Clustering behavior of cultured mesendodermal (hypoblast) and ectodermal (epiblast) progenitor cells from wild-type/cyc-overexpressing (hypoblast) and mz-oep (epiblast) embryos in the absence or presence of E-Cadherin. (A-D) Hypoblast cells from wild-type/cyc-overexpressing (A,C; red) and e-cadherin morphant/cyc-overexpressing (B,D; green) embryos, after plating out (A,B; t=0) and after 16 hours in culture (C,D; o/n). (E) Wild-type/cyc-overexpressing hypoblast cells labeled in red or green (`control/control′) after 16 hours in culture (o/n). (F) Wild-type/cyc-overexpressing hypoblast cells (labeled in red) mixed with e-cadherin morphant hypoblast cells (labeled in green) after 16 hours in culture (o/n). (G-L) Epiblast cells from mz-oep (G,I; red) and e-cadherin morphant mz-oep (H,J; green) embryos, after plating out (G,H; t=0) and after 16 hours in culture (I,J; o/n). (K) mz-oep epiblast cells labeled in red or green (`control/control′) after 16 hours in culture (o/n). (L) mz-oep epiblast cells (labeled in red) mixed with e-cadherin morphant mz-oep epiblast cells (labeled in green) after 16 hours in culture (o/n). (M-O) Wild-type/cyc-overexpressing hypoblast cells labeled in red mixed with mz-oep epiblast cells labeled in green, after plating out (M; t=0) and after 16 hours in culture (N,O; o/n); at 16 hours, mixed cultures are shown for control epiblast and hypoblast cells (N), and for epiblast and hypoblast cells injected with e-cadherin MO (O). Green, fluorescein; red, rhodamine. |
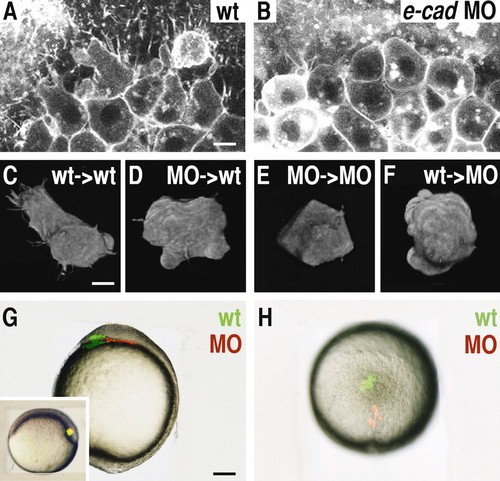
Cellular morphology and position of anterior mesendodermal (prechordal plate) cells in wild-type, e-cadherin morphant and mosaic embryos at early and late stages of gastrulation. (A,B) Face- on view at the anterior edge of the prechordal plate of wild-type (A) and e-cadherin morphant (B) embryos at 6.5 hpf. (C,D) Three-dimensional reconstruction of a transplanted wild-type (C) and e-cadherin morphant (D) cell within the anterior prechordal plate of a wild-type embryo at 7 hpf. (E,F) Three-dimensional reconstruction of a transplanted e-cadherin morphant (E) and wild-type (F) cell within the prechordal plate of an e-cadherin morphant embryo at 7 hpf. (G,H) Position of transplanted wild-type (green) and e-cadherin morphant (red) cells within the prechordal plate of a wild-type embryo at 10 hpf; lateral view with anterior to the left (G), and animal view with anterior to the top (H). The inset in G shows the position of the transplanted cells (yellow) within the shield directly after the transplantation, with dorsal to the right. For all transplantation experiments (C-H), cells were transplanted at 6 hpf and the distribution (mixing) of the different cell types was monitored straight after the transplantation. MO, e-cadherin morphant cells; wt, wild-type cells. Scale bars: in A, 20 µm; in C, 10 µm; in G, 200 µm. |
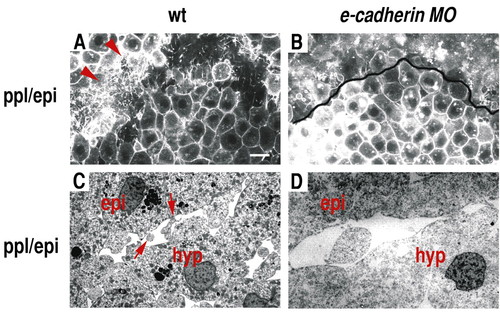
Cellular organization of the border region between prechordal plate and overlying epiblast in wild-type and e-cadherin morphant embryos at the onset of gastrulation. (A,B) Border region between prechordal plate and overlying epiblast cells in wild-type (A) and e-cadherin morphant (B) embryos at 6.5 hpf. (C,D) Electron microscopy images (frontal views) of the border region between anterior prechordal plate cells and overlying epiblast cells in wild-type (C) and e-cadherin morphant (D) embryos at 6.5 hpf. Arrowheads in A and arrows in C indicate cellular processes at the interface between prechordal plate and epiblast. ppl/epi, border region between prechordal plate and epiblast. Scale bar in A: 30 µm. |
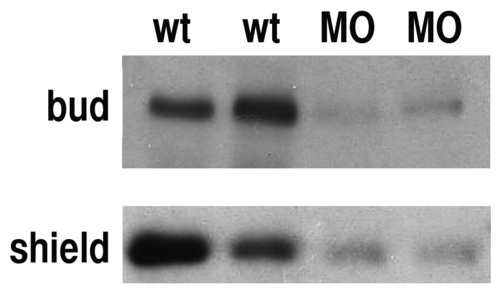
Western blot showing the total amounts of E-Cadherin protein from wild-type and e-cadherin morpholino (MO; 8ng)-injected embryos at bud (10 hpf) and shield (6 hpf) stages. The size of the band recognized corresponds to the predicted molecular weight for E-Cadherin (140 kDa) (Babb and Marrs, 2004). wt, wild type; MO, e-cadherin MO. Two independent samples for each condition with 10 embryos/sample were loaded. As a loading control, the gels were Commassie stained to check for equal amounts of protein in each lane. |