
Fig. 8
- ID
- ZDB-IMAGE-050421-8
- Publication
- Montero et al., 2005 - Shield formation at the onset of zebrafish gastrulation
- All Figures
- Figures for Montero et al., 2005
|
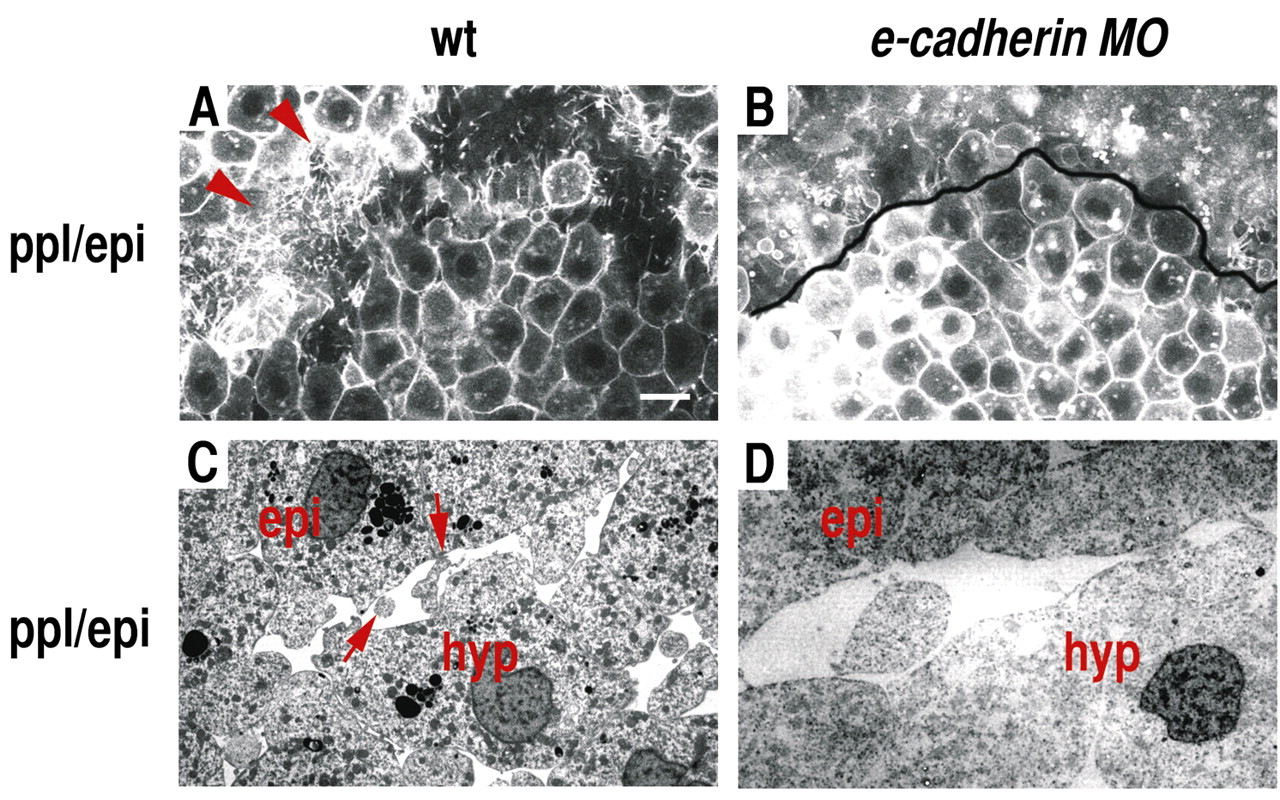
Fig. 8 Cellular organization of the border region between prechordal plate and overlying epiblast in wild-type and e-cadherin morphant embryos at the onset of gastrulation. (A,B) Border region between prechordal plate and overlying epiblast cells in wild-type (A) and e-cadherin morphant (B) embryos at 6.5 hpf. (C,D) Electron microscopy images (frontal views) of the border region between anterior prechordal plate cells and overlying epiblast cells in wild-type (C) and e-cadherin morphant (D) embryos at 6.5 hpf. Arrowheads in A and arrows in C indicate cellular processes at the interface between prechordal plate and epiblast. ppl/epi, border region between prechordal plate and epiblast. Scale bar in A: 30 µm.