
IMAGE
Fig. 4
- ID
- ZDB-IMAGE-050421-4
- Genes
- Publication
- Montero et al., 2005 - Shield formation at the onset of zebrafish gastrulation
- All Figures
- Figures for Montero et al., 2005
Image
|
Figure Caption
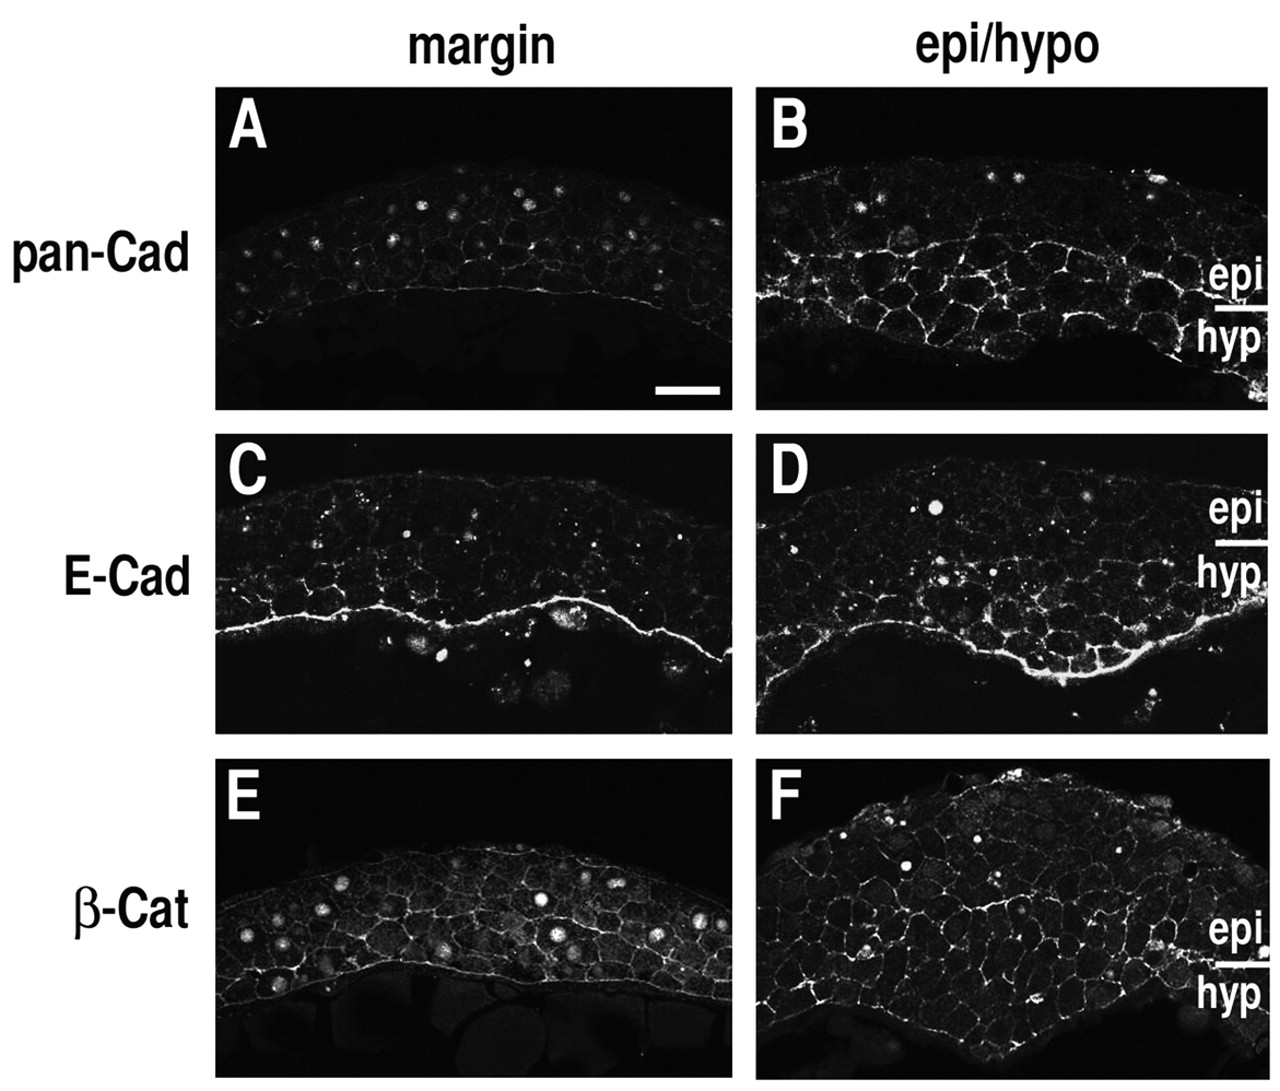
Fig. 4 Localization of pan-Cadherin, E-Cadherin and ß-Catenin in epiblast (ectoderm) and hypoblast (mesendoderm) cells within the shield at the onset of gastrulation (65% epiboly). Frontal sections of the shield region at the margin (A,C,E) and four to six cell diameters away from the margin (B,D,F) stained with an anti-pan-Cadherin (A,B), anti-E-Cadherin (C,D) and anti-ß-Catenin (E,F) antibody. epi, epiblast; hyp, hypoblast. Scale bar in A: 40 µm.
Figure Data
Acknowledgments
This image is the copyrighted work of the attributed author or publisher, and
ZFIN has permission only to display this image to its users.
Additional permissions should be obtained from the applicable author or publisher of the image.
Full text @ Development