
- Title
-
Smad1 and Smad5 have distinct roles during dorsoventral patterning of the zebrafish embryo
- Authors
- Dick, A., Meier, A., and Hammerschmidt, M.
- Source
- Full text @ Dev. Dyn.
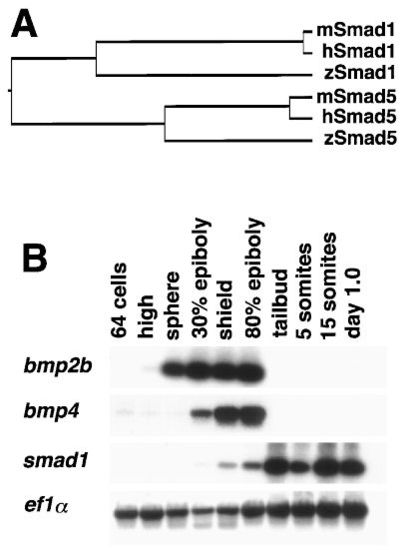
A: Phylogenetic tree of Smad1 and Smad5 from zebrafish (zSmad), mouse (mSmad), and human (hSmad), calculated according to the J. Hein method (DNAstar software). B: Temporal expression profile of zebrafish bmp2b, bmp4, smad1 and, as control, ef1α (Nordness et al., 1994), determined by reverse transcriptase–polymerase chain reaction. For bmp2b and bmp4, only stages up to the 80% epiboly stage are shown. |
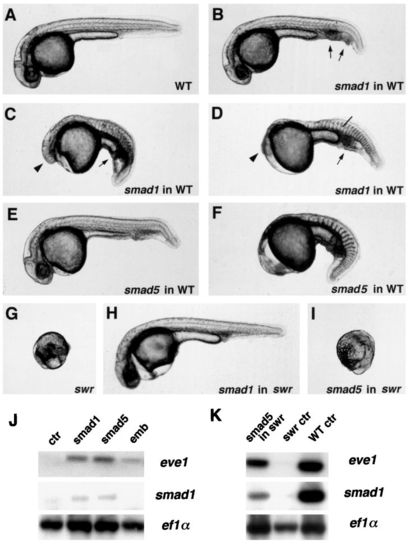
Effects of overexpressed zebrafish smad1 and smad5 in wild-type and swirl (swr) mutant embryos. All embryos are photographed at 36 hr after fertilization. A–D: Injection of variable amounts of smad1 RNA in wild-type 1-cell stage embryos. A: Uninjected control. B: 50 pg/embryo, leading to a weak ventralization (V1), characterized by extra ventral tail fin tissue and slightly enlarged blood islands (indicated by arrows). C, D: 100 pg/embryo, leading to intermediate ventralization (V2), characterized by enlarged blood islands (indicated by arrow) and smaller eyes (indicated by arrowhead), or strong ventralization (V4), characterized by enlarged blood islands (indicated by arrow) and complete loss of head structures (indicated by arrowhead) and notochord (indicated by bar). E, F: Injection of smad5 RNA in wild-type embryos. E: 100 pg/embryo, leading to V1 ventralization. F: 100 pg/embryo, leading to V4 ventralization. G–I: Injection of smad1 and smad5 RNA in swr mutant embryos. G: Uninjected swr control with ruptured yolk sac (C5 dorsalization). H: Rescued swr mutant after injection of 25 pg/embryo smad1 RNA; the embryo was genotyped as swr homozygous after photography. I: swr mutant after injection of 200 pg/embryo smad5 RNA, displaying C5 dorsalization as uninjected control. Embryos in (G) and (I) had been sorted at the tailbud stage, displaying the typical elongated “football-like” shape. Compare Kishimoto et al. (1997) for the classification of ventralization (V1–V4) and dorsalization (C1–C5) strengths. J, K: Reverse transcriptase–polymerase chain reaction analysis for transcripts of smad1, the ventral marker eve1 (Joly et al., 1993), and the control gene ef1α (Nordness et al., 1994). J: animal cap explants of wild-type embryos after injection of smad1 or smad5 mRNA and cultivation until control embryos had reached the shield stage. (K) 80% epiboly stage swirl mutant embryos from a cross of two homozygous swrta72 parents after injection of smad5 mRNA. All injected control embryos (12 of 12) that had been allowed to develop further displayed unweakened C5 dorsalization. Abbreviations: ctr, control; emb, control embryo; WT, wild type. PHENOTYPE:
|
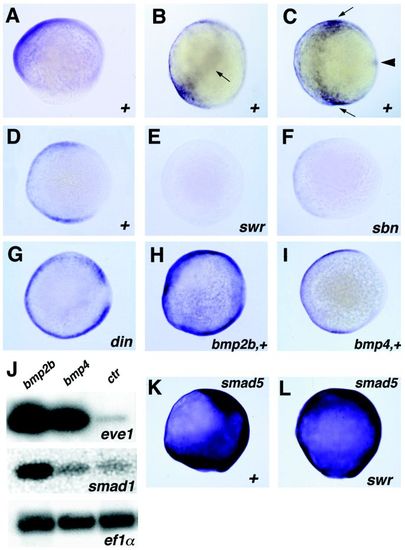
smad1 expression A–C: and regulation of smad1D–J: and smad5K,L: expression during gastrulation. A: smad1 at 80% epiboly, lateral view, dorsal right. smad1 is expressed on the ventral side of the embryo. B, C: smad1 at tailbud stage, lateral view (B) and animal view (C), dorsal right. smad1 is expressed on the ventral side of the embryo, with highest mRNA levels in lateral regions, which give rise to the epidermis and neural crest (indicated by arrows in B and C). In addition, smad1 is expressed in the notochord anlage in the dorsal midline (indicated by arrowhead in C). D–J: Ventral smad1 expression is positively regulated by Bmp2b, but not by Bmp4. D–I: smad1, 80% epiboly, animal view, dorsal right. D: Wild-type control. E: bmp2b mutant swrta72, lacking smad1 transcripts. F: smad5 mutant sbndtc24, with strongly reduced smad1 mRNA levels. G: Chordino mutant dintt250, with a dorsally expanded smad1 expression domain. H: Wild type after injection of bmp2b mRNA (2.5 pg/embryo), with a dorsally expanded smad1 expression domain and elevated smad1 mRNA levels. I: Wild type after injection of bmp4 mRNA (0.5 pg/embryo), displaying unaltered smad1 expression. J: Reverse transcriptase–polymerase chain reaction analysis for transcripts of smad1, evel (Joly et al., 1993) and ef1α (Nordness et al., 1994) in total zebrafish embryos at 80% epiboly stage after injection of 2.5 pg/embryo bmp2b mRNA or 0.5 pg/embryo bmp4 mRNA at the one-cell stage, in comparison to uninjected control embryos. Both bmp2b- and bmp4-injected embryos show a significant increase of eve1 mRNA levels, whereas an increase of smad1 mRNA levels is only seen in bmp2b-, but not in bmp4-injected embryos. bmp2b- and bmp4-injected sibling embryos of (H–J) were raised to day 1 and showed ventralized phenotypes of comparable strengths and with similar frequencies (see Table 1). K, L: smad5 is expressed independently of bmp2b. Ninety percent epiboly, lateral view, dorsal right. K: Wild type. L: swr mutant, displaying unaltered smad5 mRNA levels. The weaker signal on the ventral side of the wild-type embryo (K) is because of fewer cells in this region compared to the swr mutant (L). EXPRESSION / LABELING:
PHENOTYPE:
|
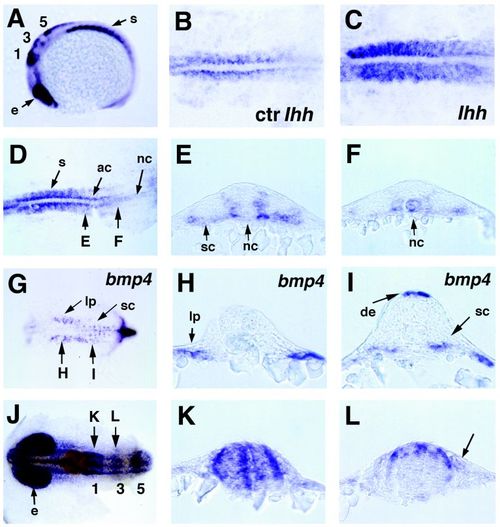
Spatial expression pattern of zebrafish smad1 during somitogenesis (A–E, J–L) in comparison to eng (J) and bmp4 (G–I), and the effect of exogenous hedgehog on somitic smad1 expression (B, C). A:smad1 at the 15-somite stage, lateral view, anterior left; smad1 shows prominent expression in somites (s), eye vesicles (e), and in dorsal regions of rhombomeres 1, 3, and 5. B, C: Somitic smad1 expression is positively regulated by hedgehog signals. Fifteen-somite stage, dorsal view on trunk of flat-mounted embryos. B: Uninjected control. C: After injection of mouse Ihh mRNA (100 pg/embryo), displaying elevated smad1 mRNA levels in all regions of the somites. Similar results were obtained after injecting mRNA encoding a dominant negative version of the regulatory subunit of protein kinase A (50 pg/embryo). D:smad1 at 15-somite stage, dorsal view on trunk of flat-mounted embryo; longer stained than embryos in (B, C). The positions of transverse sections shown in E, F: are indicated. smad1 is broadly expressed in anterior somites (s), in adaxial cells (ac) of newly formed posterior somites, and in posteriormost regions of the notochord (nc). E, F: smad1, transverse sections of 15-somite-stage embryo. E: At level of the 12th somite (anterior); smad1 is strongly expressed in presumptive sclerotome (sc) in ventral regions and in medial regions of somites adjacent to the neural tube and notochord, whereas lateral and interior somitic regions and notochord are devoid of smad1 transcripts. F: At level of the 15th somite (posterior); smad1 is expressed in the notochord, whereas somitic expression is weak and largely restricted to adaxial regions. G:bmp4, 15-somite-stage, dorsal view on trunk, anterior left, head region removed. The positions of transverse sections shown in H, I: are indicated. H, I: bmp4, transverse sections of 15-somite-stage embryo. H: At level of fourth somite (anterior); bmp4 is expressed in lateral plate mesoderm (lp). I: At level of eighth somite (posterior); bmp4 is expressed in dorsal ectoderm (de) and a ventral domain of somites, most likely the presumptive sclerotome (sc). J:smad1 (blue) and Eng (brown, detected by immunostaining) at 15-somite-stage, dorsal view on head region. eng expression marks the region of the midbrain–hindbrain boundary. Rhombomere numbers are indicated. The positions of transverse sections shown in (K) and (L) are indicated with arrows. K, L:smad1, transverse sections of 15-somite-stage embryo at level of first (K) and third (L) rhombomere. First rhombomere displays smad1 expression in three dorsoventral stripes, a medial stripe, and two lateral stripes at the periphery of the brain. At the level of the third rhomobomere, smad1 displays strongest expression in dorsal regions of the brain. In addition, smad1 is expressed in dorsal cells outside of the neural tube (indicated by an arrow in L), which might represent migrating neural crest cells. Abbreviations: ac, adaxial cells; de, dorsal ectoderm; e, eye vesicles; lp, lateral plate; nc, notochord; s, somites; sc, sclerotome. EXPRESSION / LABELING:
|
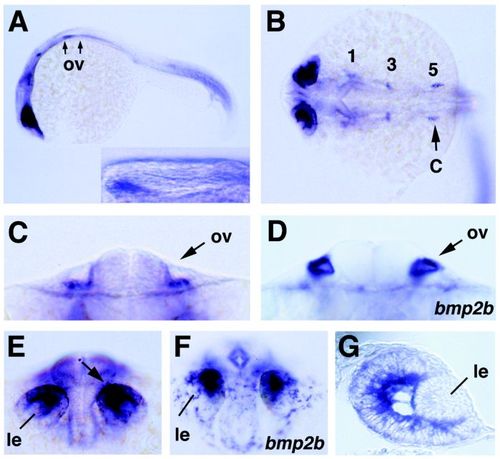
smad1 and bmp2b expression in eyes and ears. All embryos are shown at 36 hr after fertilization. A:smad1, lateral view; the anterior and posterior border of the otic vesicles (ov) is indicated by arrows. The inset shows a magnification of the indicated region with the otic vesicle. smad1 is expressed in mesenchyme ventral of the anterior region of the otic vesicle. B:smad1, dorsal view on head. Numbers 1, 3, and 5 mark the three bilateral expression domains associated with rhombomeres 1, 3, and 5. The position of the optical cross section shown in (C) is indicated. C, D:smad1(C) and bmp2b (D), optical cross section at level of otic vesicles (ov). smad1 is expressed in mesenchyme ventral of the vesicle, bmp2b in the vesicle epithelium. E, F:smad1 (E) and bmp2b (F), anterior view on head; smad1 and bmp2b are expressed in a subset of retinal cells close to the developing lens (le). In (E), the position of the section shown in (G) is indicated by an arrow. G:smad1, section through eye vesicle of embryo shown in (E); smad1 is strongly expressed in presumptive ganglion cells close to the lens, whereas expression in outer regions of the retina is rather weak. Abbreviations: le, lens; ov, otic vesicle. EXPRESSION / LABELING:
|