
Image
|
Figure Caption
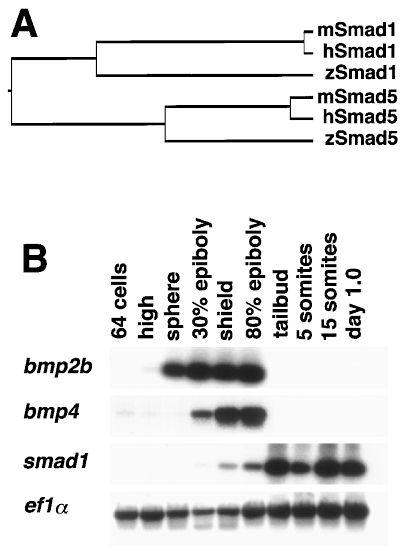
Fig. 1 A: Phylogenetic tree of Smad1 and Smad5 from zebrafish (zSmad), mouse (mSmad), and human (hSmad), calculated according to the J. Hein method (DNAstar software). B: Temporal expression profile of zebrafish bmp2b, bmp4, smad1 and, as control, ef1α (Nordness et al., 1994), determined by reverse transcriptase–polymerase chain reaction. For bmp2b and bmp4, only stages up to the 80% epiboly stage are shown.
Figure Data
Acknowledgments
This image is the copyrighted work of the attributed author or publisher, and
ZFIN has permission only to display this image to its users.
Additional permissions should be obtained from the applicable author or publisher of the image.
Full text @ Dev. Dyn.