
- Title
-
Identification of embryonic RNA granules that act as sites of mRNA translation after changing their physical properties
- Authors
- Sato, K., Sakai, M., Ishii, A., Maehata, K., Takada, Y., Yasuda, K., Kotani, T.
- Source
- Full text @ iScience
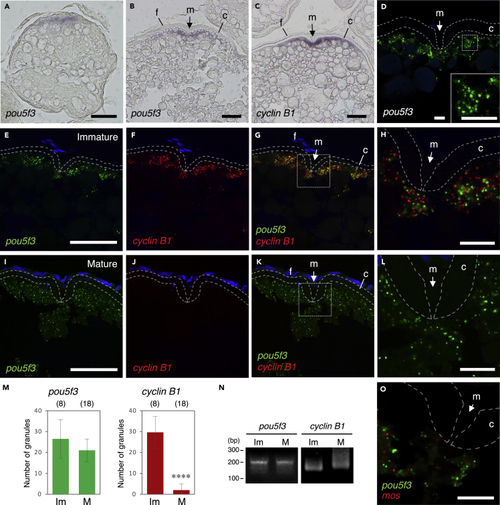
Zebrafish oocytes store pou5f3 mRNA as RNA granules that are different from those of cyclin B1 mRNA (A–C) Distributions of pou5f3 mRNA (A and B) and cyclin B1 mRNA (C) in growing (A) and fully grown (B and C) oocytes. m, micropyle; f, follicle cells; c, chorion. (D) FISH analysis of pou5f3 mRNA (green) in fully grown oocytes. An inset shows an enlarged view of the boxed region. The chorion is outlined by broken lines. DNA is shown in blue. (E–L) FISH analyses of pou5f3 (green) and cyclin B1 (red) mRNAs in fully grown immature oocytes (E–H) and mature oocytes (I–L). DNA is shown in blue. H and L show enlarged views of the boxed regions in G and K, respectively. (M) Numbers of pou5f3 (left) and cyclin B1 (right) RNA granules per 100 μm2 in individual immature (Im) and mature (M) oocytes were counted (means ± standard deviations). ∗∗∗∗p < 0.0001 (Student’s t test). The numbers in parentheses indicate the total numbers of oocytes analyzed. Similar results were obtained from three independent experiments. (N) PAT assay for pou5f3 and cyclin B1 mRNAs in immature (Im) and mature (M) oocytes. Similar results were obtained from three independent experiments. (O) FISH analysis of pou5f3 (green) and mos (red) mRNAs in fully grown immature oocytes. Bars, (A–C, E–G, and I–K) 50 μm and (D, H, L, and O) 10 μm. |
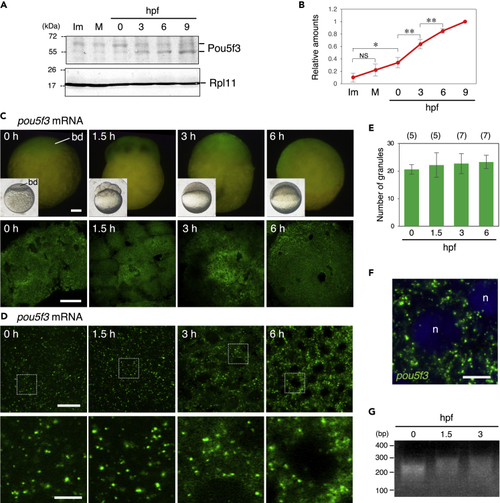
Zebrafish embryos accumulate Pou5f3 protein during the early stages of development through maintaining the granular structures of pou5f3 mRNA (A) Time courses of Pou5f3 accumulation in immature (Im) and mature (M) oocytes and in embryos at hours post fertilization (hpf). Ribosomal protein l11 (Rpl11) is a loading control. (B) The intensities of both Pou5f3 bands were quantified (means ± standard deviations; n = 5). NS, not significant; ∗p < 0.05; ∗∗p < 0.01 (Tukey-Kramer test). (C and D) Whole mount FISH analyses of pou5f3 mRNA (green) in embryos at 0, 1.5, 3, and 6 h post fertilization. (C) Upper, lateral views of embryos by fluorescent dissection microscopy. Lower, animal pole views of embryos by confocal microscopy. Insets show bright-field views of live embryos. bd, blastodisc. (D) Upper, high-resolution confocal images. Lower, enlarged views of the boxed regions in the upper images. (E) Numbers of granules per 100 μm2 in embryos at 0, 1.5, 3, and 6 hpf were counted (means ± standard deviations). The numbers in parentheses indicate the total numbers of oocytes analyzed. Similar results were obtained from two independent experiments. (F) Distribution of pou5f3 RNA granules in the cell cytoplasm. DNA is shown in blue. n, nucleus. Bars, (C) 100 μm; (D) upper, 20 μm; lower, 5 μm; (F) 10 μm. (G) PAT assay for pou5f3 mRNA in embryos at 0, 1.5, and 3 hpf. Similar results were obtained from three independent experiments. |
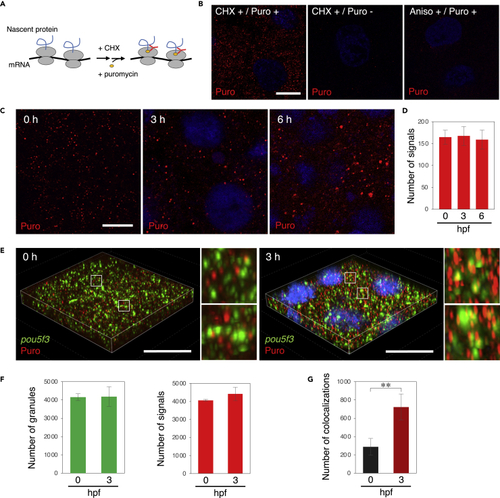
Embryos start to translate pou5f3 mRNAs at the sites of granules during the mitotic cleavage stage (A) A schematic view for visualization of newly synthesized peptides by ribopuromycylation. After pretreatment with CHX, embryos were treated with CHX and puromycin, which was detected by anti-puromycin antibody after washing out free puromycin. Note that this method also enables detection of puromycylated peptides released from polysomes. (B) Detection of newly synthesized peptides (red) with anti-puromycin antibody in cleavage-stage embryos stimulated with (+) or without (−) CHX and puromycin (Puro). As a control, embryos were pretreated with anisomycin (Aniso) instead of CHX. DNA is shown in blue. (C) Detection of newly synthesized peptides (red) in embryos at 0, 3, and 6 h post fertilization. DNA is shown in blue. (D) Numbers of signals of newly synthesized peptides per 3,600 μm2 in embryos at 0, 3, and 6 hpf were counted (means ± standard deviations; n = 3). Similar results were obtained from three independent experiments. (E) 3D images of SIM for pou5f3 mRNA (green) and newly synthesized peptides (red) in embryos at 0 and 3 h post fertilization. DNA is shown in blue. Insets show enlarged views of the boxed regions. Bars, (B and C) 10 μm, (E) 20 μm. (F) Numbers of pou5f3 RNA granules (left) and newly synthesized peptides (right) per 28,800 μm3 in embryos at 0 and 3 hpf were counted (means ± standard deviations; n = 3). (G) Numbers of colocalizations of pou5f3 RNA granules and newly synthesized peptides per 28,800 μm3 in embryos at 0 and 3 hpf were counted (means ± standard deviations; n = 3). Similar results were obtained from two independent experiments. ∗∗p < 0.01 (Student’s t test). |
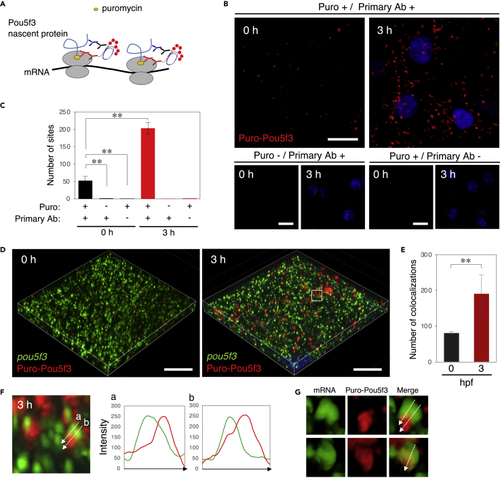
Embryos start to translate pou5f3 mRNAs at the sites of granules, termed embryonic RNA granules, during the mitotic cleavage stage (A) A schematic view for visualization of nascent Pou5f3 protein by Puro-Pou5f3 PLA. Note that this method also enables detection of nascent Pou5f3 peptides released from polysomes. (B) Detection of Puro-Pou5f3 PLA sites in embryos at 0 and 3 h post fertilization treated with (+) or without (−) puromycin (Puro). After fixation, embryos were incubated with (+) and without (−) anti-puromycin antibody (Primary Ab). DNA is shown in blue. (C) Numbers of Puro-Pou5f3 PLA sites per 10,000 μm2 in embryos at 0 and 3 hpf were counted (means ± standard deviations; n = 6). Similar results were obtained from two independent experiments. ∗∗p < 0.01 (Tukey-Kramer test). (D) 3D images of SIM for pou5f3 mRNA (green) and Puro-Pou5f3 PLA sites (red) in embryos at 0 and 3 h post fertilization. DNA is shown in blue. (E) Numbers of colocalizations of pou5f3 RNA granules and Puro-Pou5f3 PLA sites per 14,400 μm3 in embryos at 0 and 3 hpf were counted (means ± standard deviations; n = 4). Similar results were obtained from two independent experiments. ∗∗p < 0.01 (Student’s t test). (F) Enlarged views of pou5f3 RNA granules and Puro-Pou5f3 PLA sites in the boxed region in (D). Intensity profiles along the dashed lines are shown in the graphs. (G) Surface visualization of 3D images of pou5f3 mRNA (green) and Puro-Pou5f3 PLA (red). Merged images are shown (Merge). Bars, (B) 20 μm and (D) 10 μm. |
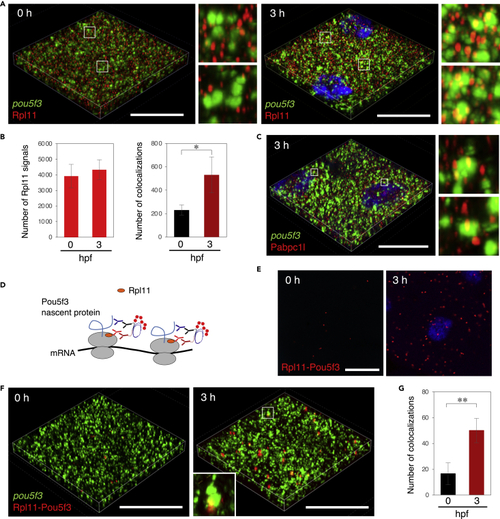
Embryos start to translate pou5f3 mRNAs within embryonic RNA granules during the mitotic cleavage stage (A) 3D images of SIM for pou5f3 mRNA (green) and Rpl11 (red) in embryos at 0 and 3 h post fertilization. DNA is shown in blue. Insets show enlarged views of the boxed regions. (B) Numbers of Rpl11 spots (left) and numbers of colocalizations of pou5f3 RNA granules and Rpl11 spots (right) per 21,600 μm3 in embryos at 0 and 3 hpf were counted (means ± standard deviations; n = 4). Similar results were obtained from two independent experiments. ∗p < 0.05 (Student’s t test). (C) 3D images of SIM for pou5f3 mRNA (green) and Pabpc1l (red) in embryos at 3 h post fertilization. DNA is shown in blue. Insets show enlarged views of the boxed regions. Similar results were obtained from two independent experiments. (D) A schematic view for visualization of pou5f3-translating sites by Rpl11-Pou5f3 PLA. RPL11 is located at the surface of large subunits of ribosomes. (E) Detection of Rpl11-Pou5f3 PLA in embryos at 0 and 3 h post fertilization. DNA is shown in blue. See Figures S5E and S5F for quantitative analysis. (F) 3D images of SIM for pou5f3 mRNA (green) and Rpl11-Pou5f3 PLA sites (red) in embryos at 0 and 3 h post fertilization. (G) Numbers of colocalizations of pou5f3 RNA granules and Rpl11-Pou5f3 PLA sites per 14,400 μm3 in embryos at 0 and 3 hpf were counted (means ± standard deviations; n = 6). Similar results were obtained from two independent experiments. ∗∗p < 0.01 (Student’s t test). Bars, 20 μm. |
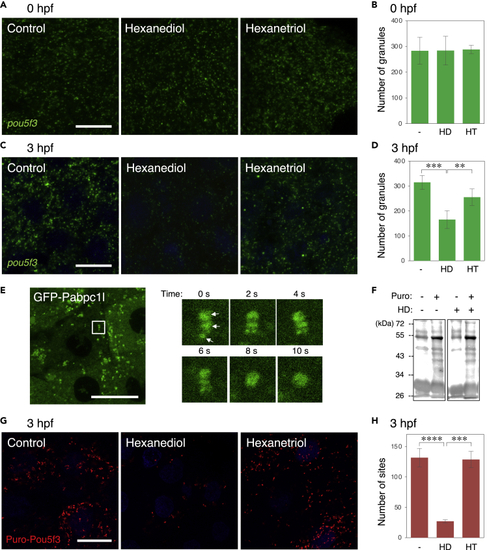
The state of embryonic RNA granules is changed from solid-like to liquid-like during early stages of development (A–D) FISH analysis of pou5f3 mRNA (green) in embryos at 0 hpf (A) and 3hpf (C) without (Control) and with hexanediol (Hexanediol) or hexanetriol (Hexanetriol). DNA is shown in blue. Numbers of pou5f3 RNA granules per 3,600 μm2 in embryos at 0 hpf (B) and 3 hpf (D) treated without (−) and with hexanediol (HD) or hexanetriol (HT) were counted (means ± standard deviations; n = 4). Similar results were obtained from two independent experiments. ∗∗p < 0.01, ∗∗∗p < 0.001 (Tukey-Kramer test). (E) Left, distribution of GFP-Pabc1l in embryos at 3 hpf. Right, time-lapse images of the boxed region in the left image showing fusion of three GFP-Pabp1l spots (arrows) into a larger spherical drop. (F) Immunoblotting analysis of puromycylated peptides in embryos at 3 hpf treated with (+) or without (−) puromycin (Puro) and hexanediol (HD). (G) Puro-Pou5f3 PLA sites (red) in embryos at 3 hpf treated without (Control) and with hexanediol (Hexanediol) or hexanetriol (Hexanetriol). DNA is shown in blue. Bars, 20 μm. (H) Numbers of Puro-Pou5f3 PLA sites per 3,600 μm2 in the embryos treated without (−) and with hexanediol (HD) or hexanetriol (HT) were counted (means ± standard deviations; n = 6). Similar results were obtained from two independent experiments. ∗∗∗p < 0.001, ∗∗∗∗p < 0.0001 (Tukey-Kramer test). |
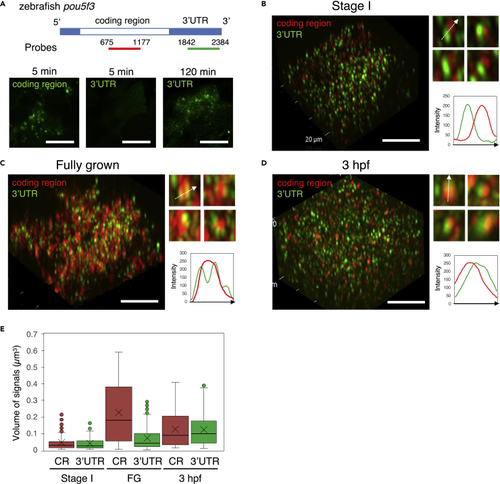
The internal structure of embryonic granules is changed during oogenesis and embryogenesis (A) Upper, Schematic diagrams of the full length of pou5f3 mRNA and location of antisense RNA probes for the coding region and 3′UTR. Lower, Detection of the coding region and 3′UTR of pou5f3 mRNA (green) with the distinct RNA probes. Before hybridization, ovary sections were treated with proteinase K for 5 min and 120 min. (B–D) 3D images of SIM for the coding region (red) and 3′UTR (green) in growing (B) and fully grown (C) oocytes and embryos at 3 hpf (D). Insets show representative pou5f3 RNA granules. Intensity profiles along the dashed lines are shown in the graphs. Bars, 10 μm. (E) Quantitative analysis of the volumes of coding region (CR) and 3′UTR signals in growing oocytes at stage I (Stage I), fully grown oocytes (FG) and embryos at 3 hpf (n ≥ 130). The mean is indicated with an X in a box. Outliers are indicated as circles. Similar results were obtained from two independent experiments. |
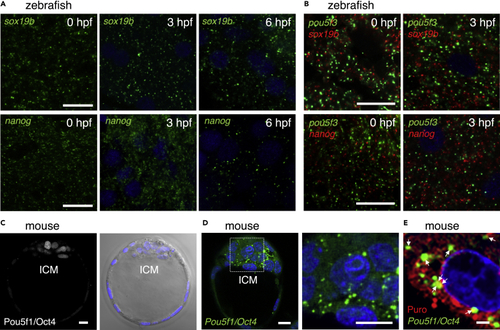
Zebrafish embryos assemble embryonic RNA granules consisting of sox19b or nanog mRNA and mouse embryos assemble those consisting of Pou5f1/Oct4 mRNA (A) FISH analyses of sox19b (upper) or nanog (lower) mRNA (green) in zebrafish embryos at 0, 3, and 6 hpf. DNA is shown in blue. Similar results were obtained from two independent experiments. (B) Double FISH analysis of pou5f3 (green) and sox19b (red) (upper) or nanog (red) (lower) mRNAs in zebrafish embryos at 0 and 3 hpf. DNA is shown in blue. Similar results were obtained from two independent experiments. (C) Immunostaining of Pou5f1/Oct4 (left) in mouse blastocysts. A bright-field image with DNA staining in blue is shown on the right. ICM, inner cell mass. (D) FISH analysis of Pou5f1/Oct4 mRNA (green) in mouse blastocysts. An enlarged image of the boxed region is shown on the right. DNA is shown in blue. Similar results were obtained from five independent experiments. (E) Simultaneous detection of Pou5f1/Oct4 mRNA (green) and newly synthesized peptides (red) in mouse blastocysts. DNA is shown in blue. Arrows indicate the regions where both signals overlapped. Bars, (A and B) 20 μm, (C and D) 10 μm, (E) 2 μm. |