
|
Fig. 7
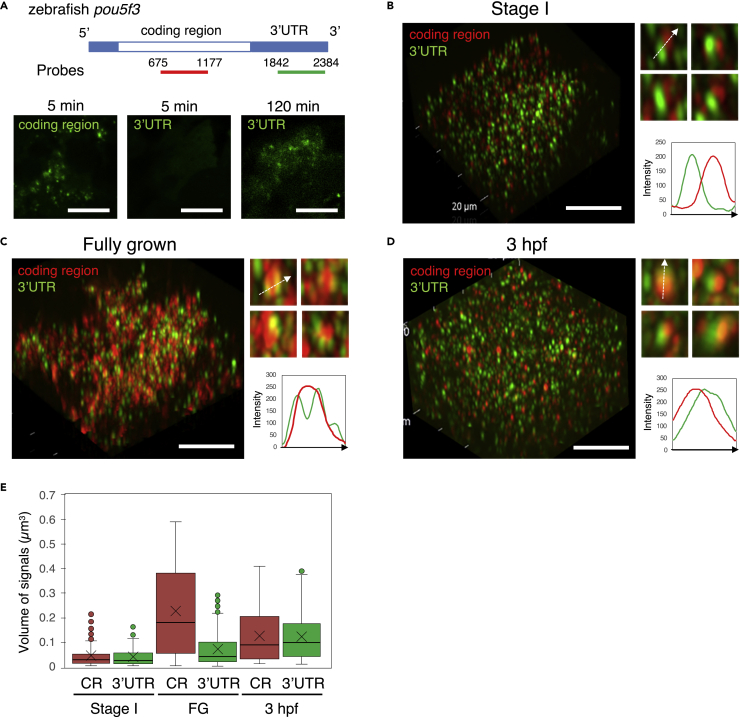
The internal structure of embryonic granules is changed during oogenesis and embryogenesis
(A) Upper, Schematic diagrams of the full length of pou5f3 mRNA and location of antisense RNA probes for the coding region and 3′UTR. Lower, Detection of the coding region and 3′UTR of pou5f3 mRNA (green) with the distinct RNA probes. Before hybridization, ovary sections were treated with proteinase K for 5 min and 120 min.
(B–D) 3D images of SIM for the coding region (red) and 3′UTR (green) in growing (B) and fully grown (C) oocytes and embryos at 3 hpf (D). Insets show representative pou5f3 RNA granules. Intensity profiles along the dashed lines are shown in the graphs. Bars, 10 μm.
(E) Quantitative analysis of the volumes of coding region (CR) and 3′UTR signals in growing oocytes at stage I (Stage I), fully grown oocytes (FG) and embryos at 3 hpf (n ≥ 130). The mean is indicated with an X in a box. Outliers are indicated as circles. Similar results were obtained from two independent experiments.