
|
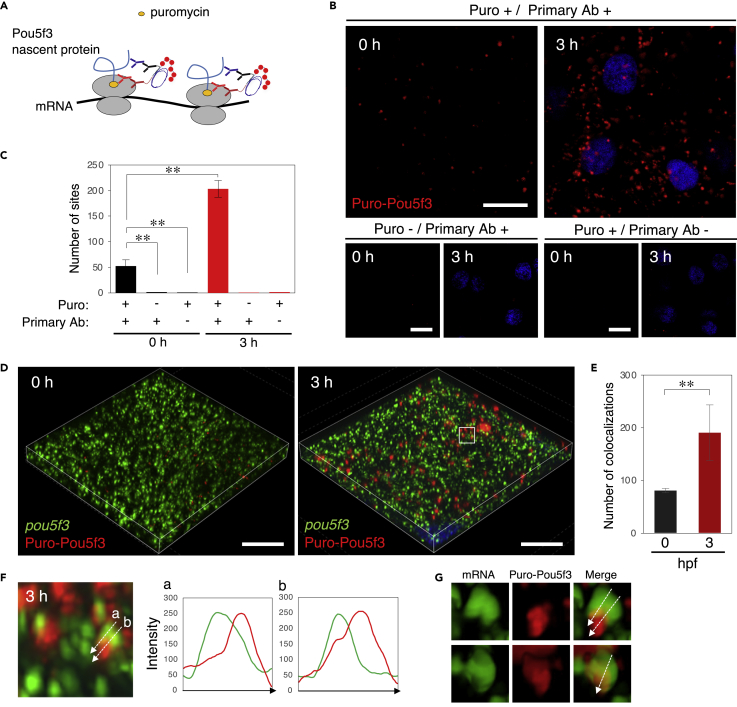
Fig. 4
Embryos start to translate pou5f3 mRNAs at the sites of granules, termed embryonic RNA granules, during the mitotic cleavage stage
(A) A schematic view for visualization of nascent Pou5f3 protein by Puro-Pou5f3 PLA. Note that this method also enables detection of nascent Pou5f3 peptides released from polysomes.
(B) Detection of Puro-Pou5f3 PLA sites in embryos at 0 and 3 h post fertilization treated with (+) or without (−) puromycin (Puro). After fixation, embryos were incubated with (+) and without (−) anti-puromycin antibody (Primary Ab). DNA is shown in blue.
(C) Numbers of Puro-Pou5f3 PLA sites per 10,000 μm2 in embryos at 0 and 3 hpf were counted (means ± standard deviations; n = 6). Similar results were obtained from two independent experiments. ∗∗p < 0.01 (Tukey-Kramer test).
(D) 3D images of SIM for pou5f3 mRNA (green) and Puro-Pou5f3 PLA sites (red) in embryos at 0 and 3 h post fertilization. DNA is shown in blue.
(E) Numbers of colocalizations of pou5f3 RNA granules and Puro-Pou5f3 PLA sites per 14,400 μm3 in embryos at 0 and 3 hpf were counted (means ± standard deviations; n = 4). Similar results were obtained from two independent experiments. ∗∗p < 0.01 (Student’s t test).
(F) Enlarged views of pou5f3 RNA granules and Puro-Pou5f3 PLA sites in the boxed region in (D). Intensity profiles along the dashed lines are shown in the graphs.
(G) Surface visualization of 3D images of pou5f3 mRNA (green) and Puro-Pou5f3 PLA (red). Merged images are shown (Merge). Bars, (B) 20 μm and (D) 10 μm.