
|
Fig. 5
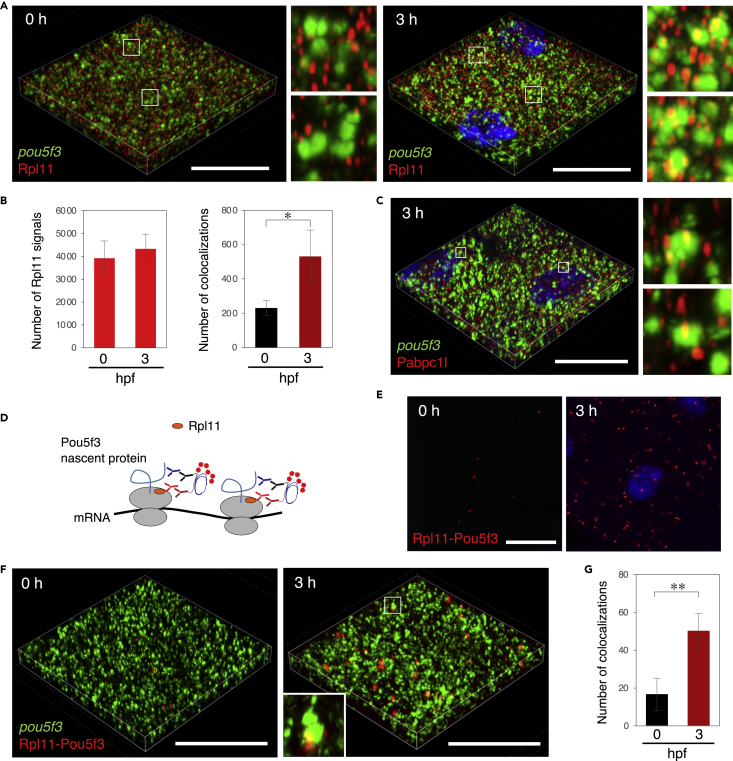
Embryos start to translate pou5f3 mRNAs within embryonic RNA granules during the mitotic cleavage stage
(A) 3D images of SIM for pou5f3 mRNA (green) and Rpl11 (red) in embryos at 0 and 3 h post fertilization. DNA is shown in blue. Insets show enlarged views of the boxed regions.
(B) Numbers of Rpl11 spots (left) and numbers of colocalizations of pou5f3 RNA granules and Rpl11 spots (right) per 21,600 μm3 in embryos at 0 and 3 hpf were counted (means ± standard deviations; n = 4). Similar results were obtained from two independent experiments. ∗p < 0.05 (Student’s t test).
(C) 3D images of SIM for pou5f3 mRNA (green) and Pabpc1l (red) in embryos at 3 h post fertilization. DNA is shown in blue. Insets show enlarged views of the boxed regions. Similar results were obtained from two independent experiments.
(D) A schematic view for visualization of pou5f3-translating sites by Rpl11-Pou5f3 PLA. RPL11 is located at the surface of large subunits of ribosomes.
(E) Detection of Rpl11-Pou5f3 PLA in embryos at 0 and 3 h post fertilization. DNA is shown in blue. See Figures S5E and S5F for quantitative analysis.
(F) 3D images of SIM for pou5f3 mRNA (green) and Rpl11-Pou5f3 PLA sites (red) in embryos at 0 and 3 h post fertilization.
(G) Numbers of colocalizations of pou5f3 RNA granules and Rpl11-Pou5f3 PLA sites per 14,400 μm3 in embryos at 0 and 3 hpf were counted (means ± standard deviations; n = 6). Similar results were obtained from two independent experiments. ∗∗p < 0.01 (Student’s t test). Bars, 20 μm.