FIGURE SUMMARY
Title

Developmental exposure to non-dioxin-like polychlorinated biphenyls promotes sensory deficits and disrupts dopaminergic and GABAergic signaling in zebrafish

Authors
Brun, N.R., Panlilio, J.M., Zhang, K., Zhao, Y., Ivashkin, E., Stegeman, J.J., Goldstone, J.V.
Source
Full text @ Commun Biol

Startle response circuit in zebrafish.

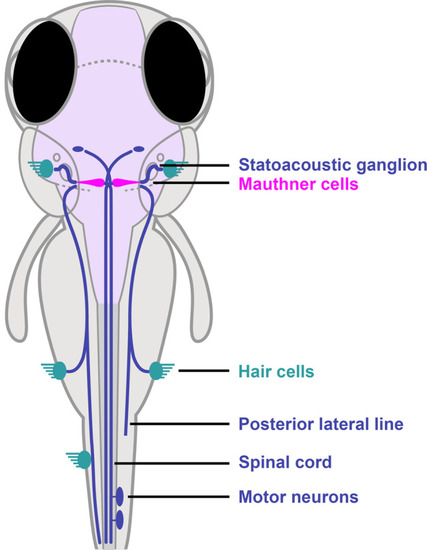
The proper execution of the auditory-evoked startle response relies on hair cells to sense the auditory stimulus, Mauthner cells to integrate the signals, and motor neurons and musculature to execute the startle behavior.

Effect of PCBs on startle response in 6 dpf zebrafish.

a Representative short-latency C-bend (SLC) and long-latency C-bend (LLC) startle response of a control zebrafish larva at 6 dpf in comparison to a typical response of a PCB153 treated larva. b Vibro-acoustic startle latency at highest stimulus intensity (43 dB) in vehicle control (n = 448), NDL PCB153 1000 nM (n = 115), NDL PCB153 100 nM (n = 226), NDL PCB153 30 nM (n = 117), NDL PCB153 10 nM (n = 112), NDL PCB138 (n = 68), NDL PCB118 (n = 99), NDL PCB52 (n = 97), and DL PCB126 (n = 86) exposed larvae. c Bias of SLC and LLC and d response rate of different exposure groups at different vibro-acoustic intensities. All data points are biologically independent samples from at least three independent experiments and mean ± SEM shown in the plots of (c, d). Binomial GLM was used for statistical analysis in (c, d). Significant differences to DMSO controls (p < 0.01) are indicated by open symbols.

Effect of PCB153 on morphology and function of lateral line hair cells and innervating neurons.

a Diagram indicating L3 neuromast. b Hair cell innervating neurons at neuromast L3 shown using Tg(cntn1b:EGFP-CAAX) and volume of hair cell innervating neurons of DMSO (n = 30) and PCB153 (n = 29) treated larvae. Scale bar = 20 µm. c Whole-mount immunostaining of kinocilia and hair cell innervating neurons (anti-acetylated tubulin antibody; green) and counterstain of stereocilia bundles and muscle tissue (actin; magenta) of DMSO (n = 26) and PCB153 (n = 24) treated larvae. The hair cell number was determined based on the number of kinocilia. Scale bar = 10 µm. d Uptake of FM1-43 dye as indication of functional hair cells of DMSO (n = 32) and PCB153 (n = 28) treated larvae. CTCF = Corrected total cell fluorescence. Scale bar = 10 µm. All data points are biologically independent samples from three independent experiments and mean ± SD are shown in the plots. Unpaired two-tailed t-test with Welch’s correction was used for statistical analysis in (b, c), a two-way ANOVA accounting for trial and treatment in (d). Asterisks indicate significant differences to controls (***p < 0.001).

Effect of PCB153 on presence and function of the Mauthner cells.

a Diagram indicating localization of Mauthner cells in the hindbrain and brain tissue immunostaining with anti-neurofilament 3A10 antibody labeling reticulospinal neurons in control and PCB153 treated larvae at 6 dpf (ventral view). Mauthner (arrow) cells were present in all brain tissues (DMSO: n = 23, PCB153: n = 21, biologically independent samples). Scale bar = 50 µm. b Diagram of electrical stimulation performed to assess the functionality of Mauthner cells. Both DMSO (n = 44) and PCB153 (n = 45) treated larvae show similar c latency to electrical stimulation and d response frequency, indicating that the Mauthner cells are present and functional, e while the C-bend angle in PCB153 exposed larvae was increased (Welch’s t-test, **p = 0.0091). All data points are biologically independent samples (one value representing the mean of seven consecutive electric field pulses) from three independent experiments and mean ± SD are shown in the plots. Mann–Whitney test was used for statistical analysis in (c), binomial GLM in (d), and unpaired two-tailed t-test with Welch’s correction in (e). Dashed lines represent median and quartiles and asterisks indicate significant differences to controls.

Involvement of neurotransmitters in startle latency.

a Neurotransmitter levels in 6 dpf larvae exposed to 1000 nM PCB153 in comparison to control (n = 4, pool of 18 larvae per sample). Unpaired t-test GABA ***p = 0.00007, choline-chloride ***p = 0.0001, L-glutamine ***p = 0.0010, 3-methoxytyramine hydrochloride **p = 0.0089, L-valine *p = 0.0202. b Startle bias shift induced by 30-min exposure to serotonin, dopamine, and GABA neurotransmitter modulators in 6 dpf control and 100 nM PCB153 exposed larvae. Control (n = 172), 5-HTP (n = 80), L-DOPA (n = 94), haloperidol (Control n = 178, PCB153 n = 81), and bicuculline (Control n = 160, PCB153 n = 173). All data points are biologically independent samples from at least three independent experiments and mean ± SEM are shown in the plots. Significant differences to respective controls (GLM, p < 0.01) are indicated by open symbols. c Representative maximum intensity z-projection from confocal stack after photoconversions of freely swimming 6 dpf CaMPARI larvae. Scale bar = 100 µm. Ratio of red to green fluorescence intensity in the rostral hindbrain (indicated by dashed line in image) in DMSO (n = 14) and 1000 nM PCB153 (n = 14) exposed swimming larvae in 4 ˚C (cold) medium. Asterisks indicate significant differences to controls (two-way ANOVA, *p = 0.0277, ***p = 0.0004). All data points are biologically independent samples from two independent experiments (trials) and the horizontal lines are indicating the mean.

Acknowledgments
This image is the copyrighted work of the attributed author or publisher, and ZFIN has permission only to display this image to its users. Additional permissions should be obtained from the applicable author or publisher of the image. Full text @ Commun Biol