FIGURE SUMMARY
Title

Automated in vivo drug screen in zebrafish identifies synapse-stabilising drugs with relevance to spinal muscular atrophy

Authors
Oprişoreanu, A.M., Smith, H.L., Krix, S., Chaytow, H., Carragher, N.O., Gillingwater, T.H., Becker, C.G., Becker, T.
Source
Full text @ Dis. Model. Mech.

Automated small-molecule compound screening follows a two-step workflow. (A) Schematic representation of the axonal phenotype in chodl−/−; mnx1:GFP embryos (left) with stalled axons at the horizontal myoseptum (HM), and zebrafish model of SMA (UBA1 model, right) showing abnormal motor axons, as used in drug screening. Chemical compounds that rescue the chodl−/−; mnx1:EGFP axonal phenotype are tested again using the UBA1 model. SC, spinal cord; NC, notochord. (B) Schematic representation of timeline and workflow of the experimental protocol. At 8 hpf, zebrafish eggs are arrayed in a 24-well plate (six eggs per well) and incubated in drug solution overnight. The next day (day 2) the 28-30 hpf embryos are moved from the 24-well plate into a 96-well plate (three embryos per well) followed by automated imaging using the VAST BioImager. In a single imaging session, between 16 and 20 chemical compounds can be tested with six embryos per compound.

Several compounds significantly increase the number of axons that grow beyond the HM. (A) Representative VAST images of 28-29 hpf drug-treated chodl mutant embryos. Arrowheads indicate CaP motor axons beyond the HM (yellow line). Scale bars: 50 µm. (B) The 12 compound hits with the highest rescue index, presented according to the percentage of motor axons that crossed the HM in comparison to that of internal control (DMSO-chodl mutant). Compounds were tested at 10 µM. Each data point represents one animal. Error bars represent means±s.e.m. (C) The 12 compound hits are ranked according to the total length of CaP motor axons after compound application. The average length of CaP motor axons in DMSO-chodl mutant is 35.06 µm. Statistical tests were performed, comparing the drug treatment with its own DMSO-chodl mutant control (dipyridamole, Kruskal–Wallis test with Dunn's multiple comparison test ***P=0.0009, statistical power=0.999; IOX1, Mann–Whitney test *P=0.0159, statistical power=0.9750; MG132, Mann–Whitney test *P=0.0242, statistical power=0.9620; apicidin, Kruskal–Wallis test with Dunn's multiple comparison test *P=0.0306, statistical power=0.9564). Grey bars represent previously published data (Opris¸oreanu et al., 2019), and are used to estimate the effect of various compounds on the length of CaP motor axons compared to that in wild-type embryos (Control) and chodl mutant embryos, in which the phenotype was rescued by stable overexpression of chodl in motor neurons (Rescue line). Each data point represents one animal, n-numbers are indicated in each bar. Error bars represent means±s.e.m.

Rescue of the axonal phenotype of the chodl−/− mutant at different concentrations of top drug hits. (A,D,G) Representative images of the lateral view of chodl mutants treated with DMSO (control), dipyridamole (10 μm or 30 μm; A), IOX1 (10 μm or 50 μm; D) or MG132 (10 μm or 50 μm; G). Arrowheads indicate CaP motor axons beyond the HM. Scale bars: 50 µm. (B,E,H) Plotted is the growth of CaP motor axons beyond the HM in response to different concentrations of dipyridamole (B), IOX1 (E) or MG132 (H), as rescue index over drug concentration. Treatment with IOX1 shows a dose-dependent rescue of the axonal phenotype in chodl mutants. (C,F,I) Quantification of the total CaP axon length after treatment with dipyridamole (C), IOX1 (F) or MG132 (I) at different concentrations compared with the total length of Cap axons treated with DMSO (control DMSO-chodl mutant). Treatment with dipyridamole (C), one-way ANOVA ****P<0.0001 with Dunnett's multiple comparison test, ****P<0.0001, statistical power=1.0000. Treatment with IOX1 (F), Kruskal–Wallis test ****P<0.0001 with Dunn's multiple comparison test ****P<0.0001, *P=0.0177, statistical power=0.9940. Treatment with MG132 (I), one-way ANOVA **P=0.0022 with Dunnett's multiple comparison test: DMSO vs 1 µM **P=0.0060, DMSO vs 5 µM **P=0.0078, DMSO vs 10 µM *P=0.0422, DMSO vs 50 µM **P=0.0077, statistical power=0.9473). Each data point represents one animal and n numbers are indicated in parenthesis. Error bars represent means±s.e.m.

Dipyridamole rescues presynaptic defects in the chodl−/−mutant. (A) Representative images of motor axons in control chodl+/+ (mnx1:EGFP) and chodl mutant fish (chodl−/−; mnx1:EGFP) after control (DMSO) or drug (dipyridamole, 10 µM) treatment. Motor axons are labelled in green, the presynaptic compartment was labelled for the synaptic marker synaptotagmin-2 (red, using Znp-1) and the postsynaptic compartment by antibodies against AChR (blue). Yellow squares indicate the horizontal myoseptum (HM). Scale bars: 10 µm. (B-D) Quantification of the presynaptic (B), postsynaptic (C) and total (D) area in zebrafish embryos as described in A. (B) The presynaptic compartment is enlarged in chodl mutants but 10 µM dipyridamole rescues this phenotype (one-way ANOVA ****P<0.0001 with Tukey's multiple comparison test: DMSO-control vs DMSO-chodl mutant ****P<0.0001, dipyridamole-control vs DMSO-chodl mutant ****P<0.0001, DMSO-chodl mutant vs dipyridamole-chodl mutant **P=0.0090, statistical power=0.9999). (C) Dipyridamole induces an increase in the total postsynaptic area in chodl mutants (one-way ANOVA *P=0.0269 with Tukey's multiple comparison test *P=0.0148, statistical power=0.7222). (D) The enlarged total synaptic area in chodl mutants is not fully rescued by dipyridamole (Kruskal–Wallis test ****P<0.0001 with Dunn's multiple comparison test: DMSO-control vs DMSO-chodl mutant ****P<0.0001, DMSO-control vs dipyridamole-chodl mutant *P=0.0194, dipyridamole-control vs DMSO-chodl mutant ***P=0.0004, DMSO-chodl mutant vs dipyridamole-chodl mutant *P=0.0382, statistical power=0.9999). (E-G) Quantification of the presynaptic (E), postsynaptic (F) and total (G) number of discernible puncta in zebrafish embryos as described in A. (E) The reduced number of presynaptic discernible puncta in chodl mutants is not fully rescued by dipyridamole (Kruskal–Wallis test ****P<0.0001 with Dunn's multiple comparison test: DMSO-control vs DMSO-chodl mutant ****P<0.0001, DMSO-control vs dipyridamole-chodl mutant **P=0.0034, dipyridamole-control vs DMSO-chodl mutant ****P<0.0001, statistical power=0.9999). (F) The reduced number of postsynaptic discernible puncta in chodl mutants is not rescued by dipyridamole (one-way ANOVA ****P<0.0001 with Tukey's multiple comparison test: DMSO-control vs DMSO-chodl mutant ****P<0.0001, DMSO-control vs dipyridamole-chodl mutant ****P<0.0001, dipyridamole-control vs DMSO-chodl mutant ***P=0.0002, dipyridamole-control vs dipyridamole-chodl mutant ***P=0.003, statistical power=0.9999). (G) The total number of discernible puncta in chodl mutants is not rescued by dipyridamole (one-way ANOVA ****P<0.0001 with Tukey's multiple comparison test: DMSO-control vs DMSO-chodl mutant ****P<0.0001, DMSO-control vs dipyridamole-chodl mutant **P=0.0039, dipyridamole-control vs DMSO-chodl mutant ****P<0.0001, statistical power=0.9995). (H,I) Labelling intensity of pre- (H) and postsynaptic (I) area in zebrafish embryos as described in A. (H) The increased presynaptic labelling intensity in chodl mutant is not rescued by dipyridamole (Kruskal–Wallis test *P=0.0249 with Dunn's multiple comparison test: DMSO-control vs DMSO-chodl mutant *P=0.0213, statistical power=0.9517). (I) Application of dipyridamole does not change the mean labelling intensity of the postsynaptic compartment in different treatment groups. chodl mutants, blue bars; wild-type embryos, white bars; with drug application (dipyridamole) and without drug application (DMSO). Each data point represents one animal, n-numbers are indicated within each bar. Error bars represent means±s.e.m.

Pre- and postsynaptic defects in chodl−/− mutants are rescued by IOX1. (A) Representative images of motor axons in chodl+/+ (mnx1:EGFP) and chodl mutant fish (chodl−/−; mnx1:EGFP) after control (DMSO) or drug (IOX1, 10 µM and 10 µM or 50 µM, respectively) treatment. Motor axons are labelled in green, the presynaptic compartment was labelled for the synaptic marker synaptotagmin-2 (red, using Znp-1) and the postsynaptic compartment by antibodies against AChR (blue). Yellow squares indicate the horizontal myoseptum (HM). Scale bars: 10 µm. (B-D) Quantification of the presynaptic (B), postsynaptic (C) and total (D) area in zebrafish embryos as described in A. (D) The presynaptic compartment is enlarged in chodl mutants but application of IOX1 rescues this phenotype (Kruskal–Wallis test ****P<0.0001 with Dunn's multiple comparison test: DMSO-control vs DMSO-chodl mutant **P=0.0011, IOX1 10 µM-control vs DMSO-chodl mutant **P=0.0011, DMSO-chodl mutant vs IOX1 10 µM-chodl mutant ***P=0.0003, DMSO-chodl mutant vs IOX1 50 µM-chodl mutant ***P=0.0002, statistical power=0.9540). (C) Application of 50 µm of IOX1 induces a decrease in the postsynaptic total area in chodl mutants (Kruskal–Wallis test **P=0.0014 with Dunn's multiple comparison test: DMSO-control versus IOX1 50 µM-chodl mutant **P=0.0039, IOX1 10 µM-control vs IOX1 50 µM-chodl mutant **P=0.0072, DMSO-chodl mutant vs IOX1 50 µM-chodl mutant **P=0.0070, statistical power=0.9526). (D) The enlarged total synaptic area in chodl mutants is rescued by IOX1 (Kruskal–Wallis test ****P<0.0001 with Dunn's multiple comparison test: DMSO-control vs DMSO-chodl mutant **P=0.0052, DMSO-chodl mutant vs IOX1 10 µM-chodl mutant **P=0.0026, DMSO-chodl mutant vs IOX1 50 µM-chodl mutant ****P<0.0001, statistical power=0.9613). (E-G) Quantification of the presynaptic (E), postsynaptic (F) and total (G) number of discernible puncta in zebrafish embryos as described in A. (E) The reduction in the number of presynaptic discernible puncta in chodl mutants is rescued by application of IOX1 (Kruskal–Wallis test ****P<0.0001 with Dunn's multiple comparison test: DMSO-control vs DMSO-chodl mutant **P=0.0059, IOX1 10 µM-control vs DMSO-chodl mutant ****P<0.0001, DMSO-chodl mutant vs IOX1 10 µM-chodl mutant **P=0.0058, DMSO-chodl mutant vs IOX1 50 µM-chodl mutant ****P=0.0002, statistical power=0.9618). (F) IOX1 does not rescue the reduced number of discernible puncta for the postsynaptic compartment in chodl mutants (one-way ANOVA **P=0.0030 with Tukey's multiple comparison test: DMSO-control vs DMSO-chodl mutant **P=0.0059, IOX1 10 µM-control vs DMSO-chodl mutant **P=0.0064, statistical power=0.9560). (G) The total number of discernible puncta in chodl mutants is rescued by application of IOX1 (one-way ANOVA ****P<0.0001 with Tukey's multiple comparison test: DMSO-control vs DMSO-chodl mutant ****P<0.0001, IOX1 10 µM-control vs DMSO-chodl mutant ****P<0.0001, DMSO-chodl mutant vs IOX1 10 µM-chodl mutant *P=0.0359, statistical power=0.9528). (H,I) Labelling intensity of pre- (H) and postsynaptic (I) area in zebrafish embryos as described in A. (H) The increased presynaptic labelling intensity in chodl mutant is rescued by IOX1 application (Kruskal–Wallis test ****P<0.0001 with Dunn's multiple comparison test: DMSO-control vs DMSO-chodl mutant ****P<0.0001, IOX1 10 µM-control vs DMSO-chodl mutant ***P=0.0004, DMSO-chodl mutant vs IOX1 10 µM-chodl mutant ***P=0.0005, DMSO-chodl mutant vs IOX1 50 µM-chodl mutant *P=0.0359, statistical power=0.9999). (I) The mean intensity of the postsynaptic compartment is unchanged between different treatment groups. chodl mutants, blue bars; wild-type embryos, white bars; with drug application (IOX1) and without drug application (DMSO). Each data point represents one animal, n-numbers are indicated within each bar. Error bars represent means±s.e.m.

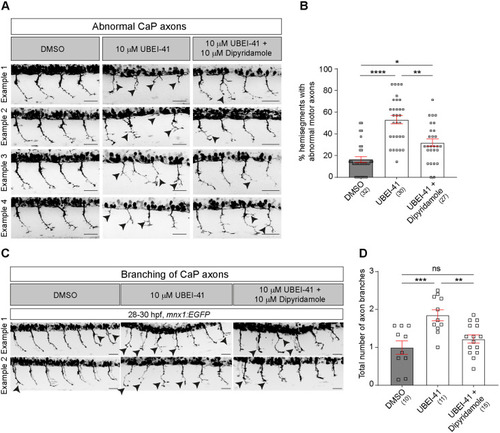
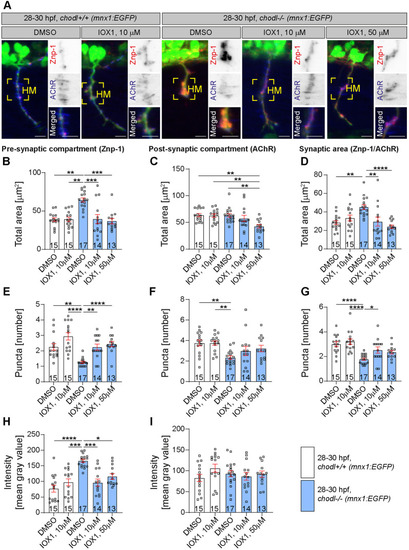
(A) Representative images of the lateral trunk of 28-30 hpf wild-type embryos. Abnormal motor neurons, i.e. short, missing or branched axons, are indicated by arrowheads. (B) The percentage of abnormal motor axons is decreased in embryos after combined treatment with UBEI-41 and dipyridamole (10 µM each) compared to those treated with UBEI-41 alone (Kruskal–Wallis test ****P<0.0001 with Dunn's multiple comparison test: ****P<0.0001, **P=0.0078 *P=0.0124, statistical power=0.999). (C) Representative images of 28-30 hpf wild-type embryos treated with DMSO, UBEI-41 or UBEI-41 and dipyridamole are shown. Abnormal axon branching is indicated by black arrowheads. Scale bars: 50 µm. (D) Quantification of axonal branching only. The number of axon branches is increased in embryos after treatment with dipyridamole (10 µM) compared to those treated with DMSO (control) (one-way ANOVA test ***P=0.0006 with Tukey's multiple comparison test: ***P=0.0007, **P=0.0062 statistical power=0.9618). All scale bars: 50 µm. Each data point represents one animal and n numbers are indicated in parenthesis. Error bars represent means±s.e.m.

Schematic representation of the results. Out of 982 chemical compounds tested, four rescue the axonal phenotype of chodl mutants and one significantly improves axon morphology in the UBA1–SMA model.

Acknowledgments
This image is the copyrighted work of the attributed author or publisher, and ZFIN has permission only to display this image to its users. Additional permissions should be obtained from the applicable author or publisher of the image. Full text @ Dis. Model. Mech.