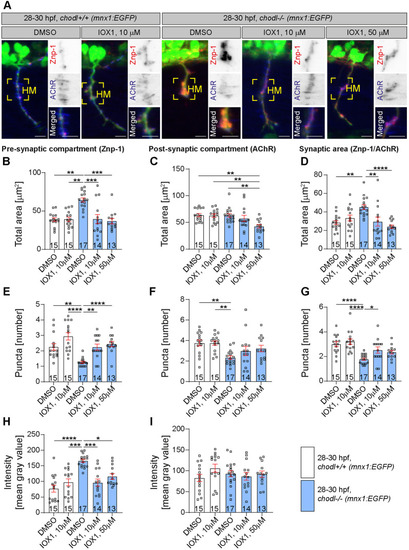
Pre- and postsynaptic defects in chodl−/− mutants are rescued by IOX1. (A) Representative images of motor axons in chodl+/+ (mnx1:EGFP) and chodl mutant fish (chodl−/−; mnx1:EGFP) after control (DMSO) or drug (IOX1, 10 µM and 10 µM or 50 µM, respectively) treatment. Motor axons are labelled in green, the presynaptic compartment was labelled for the synaptic marker synaptotagmin-2 (red, using Znp-1) and the postsynaptic compartment by antibodies against AChR (blue). Yellow squares indicate the horizontal myoseptum (HM). Scale bars: 10 µm. (B-D) Quantification of the presynaptic (B), postsynaptic (C) and total (D) area in zebrafish embryos as described in A. (D) The presynaptic compartment is enlarged in chodl mutants but application of IOX1 rescues this phenotype (Kruskal–Wallis test ****P<0.0001 with Dunn's multiple comparison test: DMSO-control vs DMSO-chodl mutant **P=0.0011, IOX1 10 µM-control vs DMSO-chodl mutant **P=0.0011, DMSO-chodl mutant vs IOX1 10 µM-chodl mutant ***P=0.0003, DMSO-chodl mutant vs IOX1 50 µM-chodl mutant ***P=0.0002, statistical power=0.9540). (C) Application of 50 µm of IOX1 induces a decrease in the postsynaptic total area in chodl mutants (Kruskal–Wallis test **P=0.0014 with Dunn's multiple comparison test: DMSO-control versus IOX1 50 µM-chodl mutant **P=0.0039, IOX1 10 µM-control vs IOX1 50 µM-chodl mutant **P=0.0072, DMSO-chodl mutant vs IOX1 50 µM-chodl mutant **P=0.0070, statistical power=0.9526). (D) The enlarged total synaptic area in chodl mutants is rescued by IOX1 (Kruskal–Wallis test ****P<0.0001 with Dunn's multiple comparison test: DMSO-control vs DMSO-chodl mutant **P=0.0052, DMSO-chodl mutant vs IOX1 10 µM-chodl mutant **P=0.0026, DMSO-chodl mutant vs IOX1 50 µM-chodl mutant ****P<0.0001, statistical power=0.9613). (E-G) Quantification of the presynaptic (E), postsynaptic (F) and total (G) number of discernible puncta in zebrafish embryos as described in A. (E) The reduction in the number of presynaptic discernible puncta in chodl mutants is rescued by application of IOX1 (Kruskal–Wallis test ****P<0.0001 with Dunn's multiple comparison test: DMSO-control vs DMSO-chodl mutant **P=0.0059, IOX1 10 µM-control vs DMSO-chodl mutant ****P<0.0001, DMSO-chodl mutant vs IOX1 10 µM-chodl mutant **P=0.0058, DMSO-chodl mutant vs IOX1 50 µM-chodl mutant ****P=0.0002, statistical power=0.9618). (F) IOX1 does not rescue the reduced number of discernible puncta for the postsynaptic compartment in chodl mutants (one-way ANOVA **P=0.0030 with Tukey's multiple comparison test: DMSO-control vs DMSO-chodl mutant **P=0.0059, IOX1 10 µM-control vs DMSO-chodl mutant **P=0.0064, statistical power=0.9560). (G) The total number of discernible puncta in chodl mutants is rescued by application of IOX1 (one-way ANOVA ****P<0.0001 with Tukey's multiple comparison test: DMSO-control vs DMSO-chodl mutant ****P<0.0001, IOX1 10 µM-control vs DMSO-chodl mutant ****P<0.0001, DMSO-chodl mutant vs IOX1 10 µM-chodl mutant *P=0.0359, statistical power=0.9528). (H,I) Labelling intensity of pre- (H) and postsynaptic (I) area in zebrafish embryos as described in A. (H) The increased presynaptic labelling intensity in chodl mutant is rescued by IOX1 application (Kruskal–Wallis test ****P<0.0001 with Dunn's multiple comparison test: DMSO-control vs DMSO-chodl mutant ****P<0.0001, IOX1 10 µM-control vs DMSO-chodl mutant ***P=0.0004, DMSO-chodl mutant vs IOX1 10 µM-chodl mutant ***P=0.0005, DMSO-chodl mutant vs IOX1 50 µM-chodl mutant *P=0.0359, statistical power=0.9999). (I) The mean intensity of the postsynaptic compartment is unchanged between different treatment groups. chodl mutants, blue bars; wild-type embryos, white bars; with drug application (IOX1) and without drug application (DMSO). Each data point represents one animal, n-numbers are indicated within each bar. Error bars represent means±s.e.m.
|
